22. Consider the sample regression equation: y = 12 + 2X1 - 6 unit, and x2 increases by 2 units, while x3 and x4 remain un expect in the predicted y? Answer:
22. Consider the sample regression equation: y = 12 + 2X1 - 6 unit, and x2 increases by 2 units, while x3 and x4 remain un expect in the predicted y? Answer:

Glencoe Algebra 1, Student Edition, 9780079039897, 0079039898, 2018
18th Edition
ISBN:9780079039897
Author:Carter
Publisher:Carter
Chapter4: Equations Of Linear Functions
Section4.6: Regression And Median-fit Lines
Problem 4GP

Related questions
Question
22
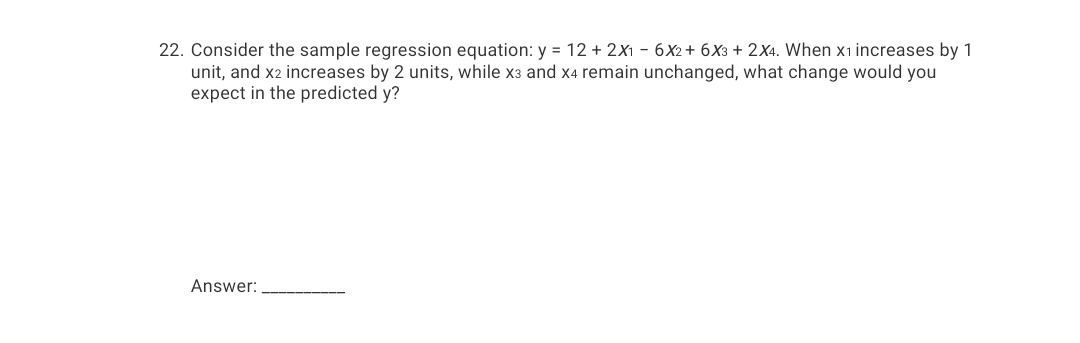
Transcribed Image Text:22. Consider the sample regression equation: y = 12 + 2X1 - 6X2+ 6X3 + 2X4. When x1 increases by 1
unit, and x2 increases by 2 units, while x3 and x4 remain unchanged, what change would you
expect in the predicted y?
Answer:
Expert Solution
This question has been solved!
Explore an expertly crafted, step-by-step solution for a thorough understanding of key concepts.

This is a popular solution!

Trending now
This is a popular solution!

Step by step
Solved in 2 steps with 2 images

Recommended textbooks for you
Glencoe Algebra 1, Student Edition, 9780079039897…
Algebra
ISBN:
9780079039897
Author:
Carter
Publisher:
McGraw Hill

College Algebra
Algebra
ISBN:
9781305115545
Author:
James Stewart, Lothar Redlin, Saleem Watson
Publisher:
Cengage Learning
Glencoe Algebra 1, Student Edition, 9780079039897…
Algebra
ISBN:
9780079039897
Author:
Carter
Publisher:
McGraw Hill
College Algebra
Algebra
ISBN:
9781305115545
Author:
James Stewart, Lothar Redlin, Saleem Watson
Publisher:
Cengage Learning