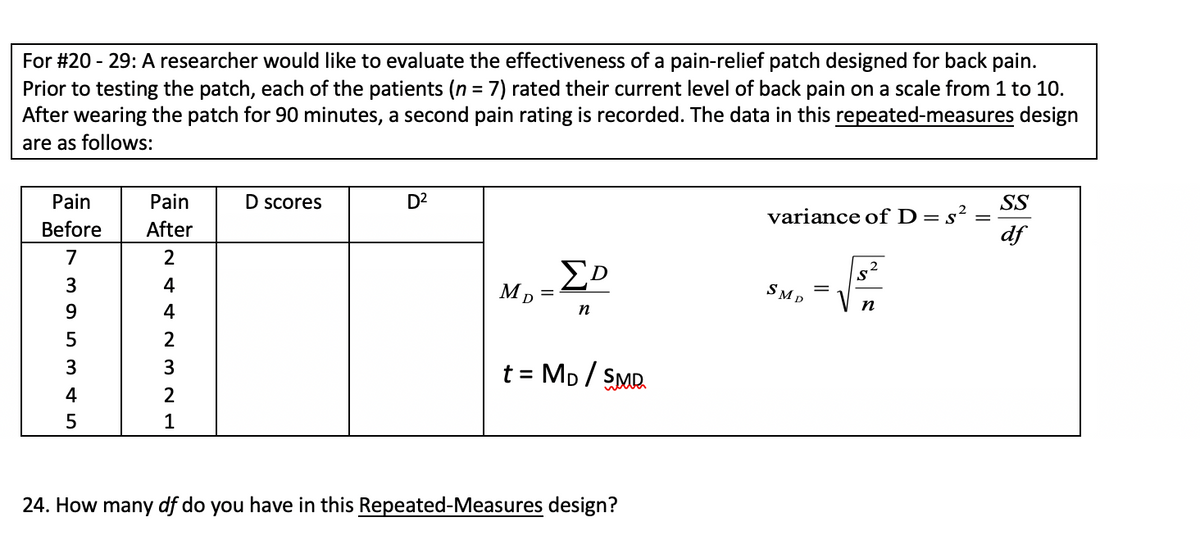
24. How many df do you have in this Repeated-Measures design?


Q: Let X and Y be random variables with joint pdf t exp(-( + y), if r2 0, y 2 0 otherwise f(x, y) = %3D…
A:
Q: Suppose I want to test whether the judges from a contestant's country rate their own contestant…
A: The objective is to find out which is the best experiment design to investigate whether the judges…
Q: For #1 - 9: The Psychology Department faculty are wondering whether a free tutoring program will…
A: We have given that Mean(µ) = 85 Sample size (n) = 28 Sample mean (x̅) = 88 Standard deviations (s) =…
Q: Use the following scenario to conduct a hypothesis test. You will again go through the different…
A: Givensample size(n)=682x=364significance level(α)=0.05
Q: When analyzing the accuracy of a machine classifier for cancer tissues, 16 of the 500 random samples…
A: Since, the exact question is not mentioned, we'll be answering the first question. Please re submit…
Q: The data represent the number of paid public holidays per year from selected nine different…
A: Hey there! Thank you for posting the question. Since there are multiple questions posted, we will…
Q: A new student arrived and took the test. They scored 70. Using the mean of 73 and standard deviation…
A: Given: Mean=73Standard deviation=9Raw score=70
Q: In a mathematics class, the scores of 10 students in their Mathematics are the following: 4 14 10 8…
A: Given data: Using Linear interpolation: 1) Arrange tha data set in increasing order,. 2) find…
Q: Suppose x has a distribution with ? = 12 and ? = 5. (a) If a random sample of size n = 39 is…
A:
Q: In a bumper test, three types of autos were deliberately crashed into a barrier at 5 mph, and the…
A: There are 3 independent samples which are Goliath, Varmint and Weasel. We have to find the variance…
Q: A study was done to provide data on sleep deprivation rates of Californians and Oregonians. The…
A:
Q: 1 Suppose you are interested in estimating the true proportion of university students who favor…
A: It is given that Margin of error E = 0.03 Level of confidence = 0.95 The critical value of Z at 95%…
Q: online used car company sells second-hand cars. For 30 randomly selected transactions, the mean…
A: Solution
Q: For #1 - 9: The Psychology Department faculty are wondering whether a free tutoring program will…
A: The random variable X follows normal distribution. We have to find the value of the test statistic.…
Q: 2. The length of life of 220 incandescent 60-watt lamps was obtained and yielded the frequency…
A: As per our guidelines we can solve first three sub part of question and rest can be reposted.…
Q: An article in Air and Waste ["Update on Ozone Trends in California's South Coast Air Basin" (Vol.…
A: Given: Days Index 91 16.7 105 17.1 106 18.2 108 18.1 88 17.2 91 18.2 58 16 82…
Q: (1 point) It has been suggusted that the highest priority of retirees is travel. Thus, a study was…
A: There are two categorical variables which are number of nights and retirement. We have to test…
Q: A large university reports that the mean salary of parents of an entering class is $111,500. To see…
A: We have given that Mean(µ) = 111500Sample size (n) = 428 Sample mean (x̅) = 109000Standard…
Q: From the following data fit a trend line and determine the trend values b the method of semi…
A:
Q: Edit View History Bookmarks Window Help oSave OFF SMH M 台90^G心 Design Layout References Mailings >>…
A: We have given that the information of survey of the COVID-19 pandemic affected academic performance…
Q: Use the following scenario to conduct a hypothesis test. You will again go through the different…
A: Given: p = 0.58 x = 364 n = 682 α = 0.05
Q: Explain the terms relative risk, odds ratio, and Pearson correlational coefficient and explain when…
A: Relative Risk (RR) Odds Ratio (OR) & Pearson Correlational Coefficient
Q: Use the currency exchange rates in the table for the following question. Currency British pound…
A:
Q: The mean number of arrivals per minute is 4. Find t probability that (a) no customers are waiting in…
A: X is the number of occurrences per interval for which the probability is being computed. λ is the…
Q: The mean score and standard deviation of the test scores of students in Section 208 of a statistics…
A: For section 208 Population mean μ1=25.4, standard deviations σ1=4.85 For section 209 Population…
Q: 66.5 160 67.5 110 68.5 50 69.5 20 70.5 5 71.5-72.5 1,000 Test the normality of the distribution.
A:
Q: 24. The National Education Association (NEA) states that the national mean salary of public school…
A:
Q: Illustrate and find the area under the stand normal curve 1. Between z= -1.45 and z=1 2. To the left…
A: Let Z be the random variable from standard normal distribution with mean = 0 and standard deviation…
Q: the 85.7% confidence interval estimate for p was (0.14, 0.16). Find p′ and ME.
A:
Q: LET' PRACTICE. Given set A =(15,19,23, 25, 37,39, 43}. Find the following a. lower quartile b. upper…
A: The given data is already arranged in ascending order15, 19, 23, 25, 37, 39, 43sample size(n)=7
Q: The amount of time spent in prison has a mean of 5.2 years and a standard deviation of 1.3 years. A…
A: Consider that μ is the true population mean amount of time spent in prison.
Q: fa man originally paid $3000 in property taxes, what will his new ta: His new tax payment will be $…
A: Original tax paid by man=$3000 A man saves 11% this year
Q: Which of the following better approximates the variance of the sample means? b. 4. VN-n N-1 a. 4 vn
A: Varince is the measure of dispersion. It used to understand the variance of each observation from…
Q: Two-Way Classification Designs An experiment was designed to test the effects of five levels of…
A: 1. From the given information, L1 L2 L3 L4 L5 P1 63.3 55.8 62.9 63.8 70.9 P2 62.3 68.7…
Q: Determine the value A (to 2 decimal places) of the following p.d.f.: A(1-x²) -1<x<1 s(x)= otherwise…
A: Solution
Q: A sample of 13 small bags of the same brand of candies was selected. Assume that the population…
A: Given, n= 13 mean= 3 std. dev. =0.15 Population std. dev. = 0.1 Confidence interval for mean: Error…
Q: (On even number of data) From the following data fit a trend line and determine the trend values b…
A:
Q: Error = (ý - y)2 20 19.8 0.04 21.1 20.77 0.1089 17.6 20.77 10.0489 16.5 16.8 0.09 17.5 17.59 0.0081…
A: *Answer: Step 1 a) From the given information, The errors are, Error -0.2 -0.23 3.17…
Q: The following table lists the monthly incomes (in hundreds of dollars) and the monthly rents paid…
A: Formula for correlation coefficients r. r= SSXY/√SSXX*SSYY
Q: STEP 4: Decision Rule 28. H p 0.50 H p>0.50 FAIL TO REJECTHO REJECT H ACCЕРТ Н, mean 0.50 standard…
A: For the given data Find
Q: The number of books sold weekly for 6 Weeks by a book store 69 65 66 71 68 73 Class Frequency 61-65…
A: Grouped mean =68.833
Q: What is the expected count a for the number of people ages 11- 25 who prefer piglets?
A:
Q: Find the expected count and the contribution to the chi-square statistic for the (C,E) cell in the…
A: expected count and the contribution to the chi-square statistic for the (C,E) cell in the two-way…
Q: 35. Which statement below accurately describes the relationship between the alpha level, the size of…
A: We have given the following statement the relationship between the alpha level, the size of the…
Q: Comple area and the t-value for each percentiles and the sample size.
A: here complete table using given information
Q: Two samples are taken with the following sample means, sizes, and standard deviations x¯1 = 40 x¯2 =…
A:
Q: a.) Using Earth's estimated cratering rate of Ncum (D > 22.6 km) = 1.8 x 10⁻¹⁵ craters/km2/yr, and a…
A:
Q: 47. For an Independent-Measures t-statistic, what is the effect of increasing the number of scores…
A: Given that - 47. For an Independent-Measures t-statistic, what is the effect fincreasing the number…
Q: Illustration 15.7 Following is the distribution of students according to their height and weight.…
A:
Q: fast please For the following, identify the type of data (quantitative discrete, quantitative…
A: Here we have to identify the type of data (quantitative discrete, quantitative continuous…
24

Step by step
Solved in 2 steps

- For the following exercises, consider this scenario: The population of a city increased steadily overa ten-year span. The following ordered pairs show the population and the year over the ten-year span (population, year) for specific recorded years: (3,600,2000);(4,000,2001);(4,700,2003);(6,000,2006) 44. What is the correlation coefficient for this model tothree decimal places of accuracy?A study conducted by students in an AP Psychologyclass at South Kent School in Connecticut discovereda correlation of –0.38 between hours of sleep (x) andGPA (y). If we change the variable on the horizontal axisto hours awake (24 - x), but make no change to theGPA data, which of the following would be true aboutthe new scatterplot?A) It slopes down, and the correlation is -0.38.B) It slopes down, and the correlation is +0.38.C) It slopes up, and the correlation is -0.38.D) It slopes up, and the correlation is +0.38.E) None of the above choices is correct.(Source: http://www.cardinalnewsnetwork.org/south-kent-community/sleep-study-sks-style/)X Y 1 6 4 1 1 4 1 3 3 1 Which of the following scatterplots accurately depicts this set of scores?
- Given that SSxx=265, SSyy=172, and SSxy=184, What is the value of the correlation coefficient?A set of n = 10 pairs of scores has ΣX = 20, ΣY = 30, and ΣXY = 74. What is the value of SP for these data?Given that SSxx=213, SSyy=176, and SSxy=180, What is the value of the correlation coefficient? (Round to two decimal places).
- for a population with a µ = 60 and σ = 12 Find the z-score for an x value of 75For each of the following statements, indicate whether you believe the statement is true or false. If you correlate two quantitative variables, called “x” and “y,” the correlation will not change if you switch which variable is “x” and which is “y.” To compute r, both variables must be quantitative (or numerical). The correlation coefficient is not affected by outliers.If r = 0.5 and N = 4, would you conclude that a positive correlationexists between the two variables? Explain your answer. Whatif N = 500?
- For each problem, select the best response. (a) In a scatterplot of the average price of a barrel of oil and the average retail price of a gallon of gasoline, you expect to see A. a positive association. B. very little association. C. a negative association. D. None of the above. (b) If the correlation between two variables is close to 0, you can conclude that a scatterplot would show A. a cloud of points with no visible pattern.B. no straight-line pattern, but there might be a strong pattern of another form. C. a strong straight-line pattern. D. None of the above. (c) You have data for many years on the average price of a barrel of oil and the average retail price of a gallon of unleaded regular gasoline. When you make a scatterplot, the explanatory variable on the x -axis A. is the price of gasoline. B. can be either oil price or gasoline price. C. is the price of oil. D. None of the above.The relationship between the number of hours a person practices a task and the time it takes them to complete the task is calculated to have R2 = 56.7 %. The value of the correlation coefficient is?In general, ___________% of the values in a data set lie at or below the 28 th percentile. _______________ % of the values in a data set lie at or above the 90 th percentile.. If a sample consists of 700 test scores, _________of them would be at or below the 52 th percentile. If a sample consists of 700 test scores, ________ of them would be at or above the 64 th percentile.