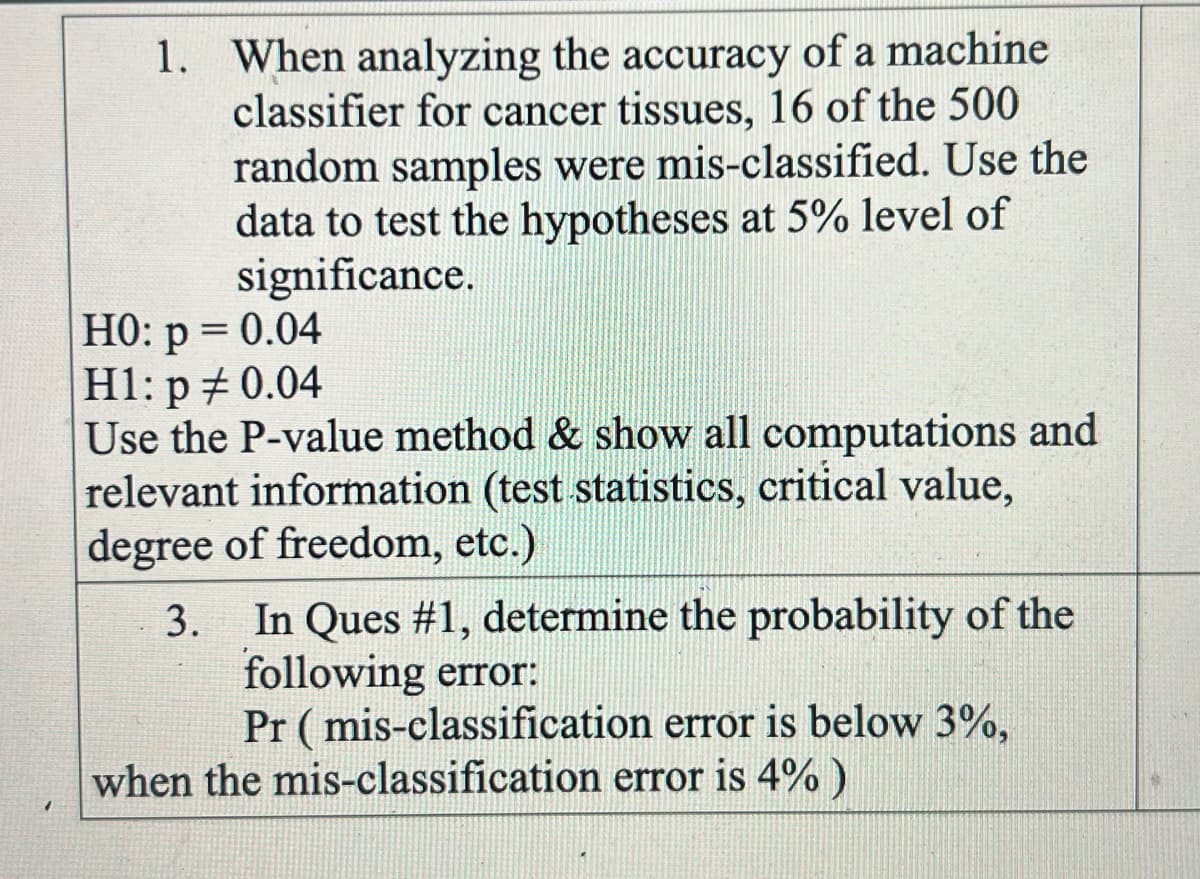
When analyzing the accuracy of a machine classifier for cancer tissues, 16 of the 500 random samples were mis-classified. Use the data to test the hypotheses at 5% level of significance.


Q: Suppose predicted value of y given that the wife has an IQ of 90? Use a significance level of 0.05.…
A: Given that n=20 , Xbar=100.88 , Ybar=100.7 , r=0.914 y^=-10.01+1.1x
Q: A random sample is drawn from a population of unknown standard deviation. Construct a 99%…
A: Formula : CI=point estimate ± ME
Q: A city planner wants to estimate the average monthly residential water usage in the city. He…
A: The confidence interval is an alternative to hypothesis testing.
Q: In 2010, the proportion of Texans without health insurance was 0.11. To update this information a…
A:
Q: You are conducting a hypothesis test about income where the research (alternative) hypothesis is…
A:
Q: You are conducting a hypothesis test about body temperature where the null hypothesis is that mu is…
A: Solution
Q: Two-Way Classification Designs The data (see picture) shows the yield in an experiment on four…
A: Given :
Q: Consider the following actual demand and forecast data for ARX AG a national distributor of…
A:
Q: I want to assess whether different types of movies increase viewers’ stress response. I recruit 24…
A: For the given data write the null and alternative hypotheses
Q: What is the point estimate of the population mean? What is the point estimate of the population…
A: We have given that the data from the normal population. Note: According to Bartleby expert…
Q: The following table shows quarterly demand (in thousand units) for a product over 4 years. Year 1…
A: Since, the exact question number is not specified, we'll be answering the first question. Please…
Q: Two researchers studied the relationship of positive emotions and longevity by examining smile…
A: Given that, Two researchers studied the relationship of positive emotions and longevity by assessing…
Q: You are conducting a hypothesis test where the null hypothesis is that mu is less than or equal to…
A:
Q: The following figures are the production data of a sugar factory. Year : |1988 |1989 |1990 1991 1992…
A:
Q: What was the mean and standard deviation of the sample
A: A sample of 16 was used to find that the 95% interval estimate for μ was (38.2405725, 42.9394275).
Q: Suppose that historically, 66% residents in an apartment building own at least one pet. If there are…
A:
Q: A factory produces bars of chocolate that follow a Normal Distribution with a mean weight of 70g and…
A: Given that. X~N( μ =70 , ?^2=9 ) μ=70 , ?=3 Z-score =( x - μ )/?
Q: ... a. Assume that nothing is known about the percentage of passengers who prefer aisle seats.…
A:
Q: The manager of an assembly process wants to determine whether or not the number of defective…
A: Given that The manager of an assembly process wants to determine whether or not the number of…
Q: If the standard deviation is low, the scores are close to each other O the same O far apart some are…
A: In order to get a proper idea about the overall nature of a given set of values, it is necessary to…
Q: Telles, Singh, and Balkrishna (2012) reported that yoga training improves finger dexterity. Suppose…
A: Case i ) Sample size n = 4 μ = 50σ = 8x¯ = 50+3 = 53 units as there is an increase α = 0.05 Case…
Q: roblem (6) A study used 1259 patients who had suffered a stroke. The study randomly assigned each…
A: Given n1=634 p1= 25/634 = 0.0394 n2= 625 p2=18/625 = 0.0288 Find Part a and b
Q: If a student has a Z-SCORE of 1.8, what percentile are they in. (Use the Z-SCORE TABLE) Standard…
A: Given: Z = 1.8
Q: The following table is from a publication. The individuals in the following table have an eye…
A: Solution: The observed frequency table is Tyep of irritation 18-29 30-44 45 -64 65 and older…
Q: You are conducting a hypothesis test about body temperature where the null hypothesis is that mu is…
A: Given that Null hypothesis H0 : μ≤98.6 Alternative hypothesis H1 : μ>98.6 Hypothesized…
Q: (a) To compute probabilities regarding the sample mean using the normal model, what size sample…
A:
Q: If N persons are seated at a round table find the probability that two named persons are neighbours…
A: Here Given N persons seated at a round table.
Q: Obtain the exponential trend equation and the trend values for the following data. 1992 1993 1994…
A:
Q: 9 Some fruit are sold whose weights follow a normal distribution such that X-N(90, 16) If the…
A: We have given the normal distribution. Mean = 90 Variance= 16 Standard deviation = 4
Q: study of 1,666 US older adults found that 40.4% rate their mental health as very good. What is the…
A: Given that n=1666 , p=40.4%=0.404
Q: Lengths of metal rulers produced by a machine are normally distributed with a mean length of 30 cm…
A:
Q: a. Using the pairs of values for all 10 points, find the equation of the regression line. b. After…
A: a. From the scatterplot the points are (2,9), (4,2), (4,3), (4,4), (5,2), (5,3), (5,4), (6,2),…
Q: Consider the following ANOVA experiments. (Round your answers to two decimal places.) (a) Determine…
A:
Q: 1 Student exam results as a percentage are modelled by a Normal distributionwhere X- N(75, 100).…
A: (1) X~N(μ, σ2) = X~N(75, 100) Let X be the random variable from normal distribution with mean (μ) =…
Q: A producer of soft drinks was fairly certain that her brand had a 10% share of the soft drink…
A: Givenp=0.10n=2500x~Binomial(n=2500,p=0.10)P(X=x)=(nx)×px×(1-p)n-x ; x=0,1,..,n
Q: A cola-dispensing machine is set to dispense on average 7.00 ounces of cola per cup. The standard…
A: Given that X~Normal(μ =7 , ? = 0.1) μ = 7 , ? = 0.1 Note: According to bartleby experts question…
Q: Past studies have indicated that the percentage of smokers was estimated to be about 32%. Given the…
A: Given P=32%=0.32 Sample size (n)=1820 X=532 Significance level=0.05
Q: A study shows that the normal time that a customer occupied a table in a fine dine restaurant is 1.2…
A:
Q: The mass of packages from a particular machine are normally distributed with a mean of 100g and…
A: Given that ; μ = 100 g ?2 = 16 g By using standard normal distribution we solve this problem
Q: Based on this information, which one of the following statements is correct? If a…
A: We have given that Claim: The true population proportion of adults who favour the colour purple is…
Q: Find the total of the areas under the standard normal curve to the left of z1z1 and to the right of…
A: Solution
Q: The Joint Distribution of the Minimum and, Maximum Def EX2: Pyoof it Fx1),X(m) (X, Y) = P(X(1) < ¤,…
A: We need to prove the joint distribution of the minimum and maximum: FX(1) ,X(n) (x,y)=P(X(1)≤x,…
Q: Which of the following is not true. O Short term sigma is R-bar divided by d2. Standard deviation is…
A: The main aim of control charts is to find whether is the process is capable (or) incapable. That…
Q: A random sample is drawn from a normally distributed population of unknown standard deviation.…
A:
Q: Random samples of 125 are taken from a population where μ = 170. 49.2% of all sample means were…
A:
Q: For what lengths will a bolt be destroyed?
A: here given, mean = 7cm standard deviation = 0.10 cm
Q: researcher expects a treatment to produce an increase in the population mean. Assuming a normal…
A: Here, we know that for t-critical, we will use z-standard normal table. At 1% and 5 %.
Q: Assume that all grade-point averages are to be standardized on a scale between 0 and 6. Hov many…
A: Given that Margin of error=E=0.005 ?=1.5 98% confidence level
Q: In an old study, the weight of a certain breed of pig had a standard deviation of 3.8 pounds. What…
A: Solution
Q: In which scatter plot is r= -0.7? (A) (B) (C) (D) . (E) (F) ... The graph ) shows a scatter plot…
A: we have given that r = - 0.7

Step by step
Solved in 2 steps

- Researchers interested in lead exposure due to car exhaust sampled the blood of 52 police officers subjected to constant inhalation of automobile exhaust fumes while working traffic enforcement in a primarily urban environment. The blood samples of these officers had an average lead concentration of 124.32 µg/l and an SD of 37.74 µg/l; a previous study of individuals from a nearby suburb, with no history of exposure, found an average blood level concentration of 35 µg/l. Write down the hypotheses that would be appropriate for testing if the police officers appear to have been exposed to a higher concentration of lead. Explicitly state and check all conditions necessary for inference on these data. Test the hypothesis that the downtown police officers have a higher lead exposure than the group in the previous study. Interpret your results in context. Based on your preceding result, without performing a calculation, would a 99% confidence interval for the average blood concentration…In a clinical study, a random sample of 540 participants agree to have their blood drawn, which is to be examined for the presence of antibodies against a certain contagious disease. It is found in 22% of the blood samples, which experimenters hope to extrapolate to the general population. From this random sample, 10 participants' blood samples are selected at random. If X is the number of samples out of the 10 who have these antibodies, what can we say about X? A. The sample size is not large enough for us to approximate X using a normal distribution B.The expected value of X is 22 C. X can be approximated using a normal distribution in lieu of a binomial distribution D. X has a sampling distribution that is normalA study was conducted to examine if children with autism spectrum disorder (ASD) had higher prenatal exposure to air pollution, specifically particulate matter < 2.5 g in diameter (PM2.5). Researchers obtained birth records of all children born in Los Angeles between 2000 and 2008 and linked these to the Department of Developmental Services records to determine if any of those subjects had been diagnosed with ASD or not. They used the birth addresses given in the birth records to determine the average daily PM2.5 for the third trimester for each child. The standard deviation for PM2.5 among ASD subjects was found to be 34.6 and for non-ASD subjects was 16.8. Assume PM2.5 is normally distributed. 4a. What was the study design? * Randomized Clinical Trial (RCT) * Case Report * Nested Case-Control Study * Case-Control Study * cross-sectional study Cohort Study 4B. What are the null and alternative hypotheses? 4c. What type of statistical test would you use to analyze the…
- Consider number of male doctors in military and civilian hospitals. Test claim there is a smaller proportion of male doctors in military than in civilian life at alpa= 0.05 Military 1 Civilian 2 Male doctors 358 6786 Total doctors 407 7363 a. At the 0.05 level of significance, the data provides insufficient evidence to conclude that the population proportion of male military doctors is less than the population proportion of male civilian doctors. b. At the 0.05 level of significance, the data provides sufficient evidence to conclude that the population proportion of male military doctors is more than the population proportion of male civilian doctors. c. At the 0.05 level of significance, the data provides insufficient evidence to conclude that the population proportion of male military doctors is more than the population proportion of male civilian doctors. d. At the 0.05 level of significance, the data provides sufficient evidence to conclude…1) A cement producer, manufactures and then fills 40kg-bags of powder cement on twodistinct production tracks located in separate suburbs. To determine whether differencesexist between the average fill rates for the two tracks, a random sample of 25 bags fromTrack 1 and a random sample of 16 bags from Track 2 were recently selected. Each bag’sweight was measured and the following information measures from the samples arereported:Production ProductionTrack 1 Track 2n1 = 25 n2 = 16x2 = 40.02 x1 = 39.87 s1 = 0.59 s2 = 0.88 Supervision believes that the fill rates of the two tracks are normally distributed with equalvariances.Construct a 95% confidence interval estimate of the true mean difference between the twotracks.--------------------------------------------------------------------------------------------------------------2) Two independent simple random samples were selected from two normallydistributed populations with unequal variances yielded the following information:Sample 1…Texas Instruments produces computer chips in production runs of 1 million at a time. It has found that the fraction of defective modules can be very different in different production runs. These differences are caused by small variations in the set-up of each production run. Managers have observed that defective rates are roughly triangular, with a lower bound of 0%, and an upper bound of 50%. Defects more likely to be near 10% than any other single value in their range. Now suppose that we have taken a sample of 10 modules, and 2 of them are defective. i. What is the conditional probability of a defective rate less than 25% in this production run?ii. For what number M would you say that the defective rate is equally likely to be above or below M?
- A certain percentage of items produced have some defects. To estimate the defect rate p, a collection of 100 items sampled from production revealed that 10 items contained suchdefects.1. Formulate and test the appropriate null H0 and alternative hypotheses H1 to verify the claim that the defect rate is smaller than 0.15 at level α = 0.1 2. Find the P-value. Based on the P-value, can you reject H0 at level α = 0.01?A law enforcement agent believes that more than 88% of the drivers stopped on Saturday nights for speeding are under the influence of alcohol. A sample of 60 drivers who were stopped for speeding on a Saturday night were taken and 54 of the drivers in the sample were under the influence of alcohol. Question 17State the null and alternative hypotheses. Question 18Determine the critical value and rejection region (rounded off to three decimals).A recent study examined the effects of carbon monoxide exposure on a group of construction workers. The following table presents the numbers of workers who reported various symptoms, along with the shift (morning, evening, or night) that they worked. Morning Shift Evening Shift Night Shift Influenza 19 12 17 Headache 15 33 6 Weakness 12 14 7 Shortness of Breath 6 10 7 Send data to Excel Test the hypothesis of independence. Use the =α0.10 level of significance and the P-value method with the TI-84 Plus calculator. What do you conclude? H0: The shift and reported symptoms are/are not independent. H1: The shift and reported symptoms are/are not independent. This hypothesis test is a left tailed/right tailed/two tailed test.
- (1) Conduct a hypothesis test, at the 5% level of significance, to determine whether ? is significant (2) What would be the growth of the plant if 4g of fertilizer and 7g of ater was given to it daily? (3) Carry out an F -test at the 1% significance level to determine whether the model is significantWe want to estimate the proportion of individuals in a population who are in favor of a certain bill with a margin of error of at most 0.015. a. What is the minimum sample size needed to satisfy this requirement, with 90% confidence? Consider in your calculations that there is no knowledge about the proportion of individuals in favor of the bill. b. What is the minimum sample size needed to satisfy this requirement, with a confidence of 90%, using the additional information that the proportion must be at most equal to 0.15?A humane society claims that less than 39% of U.S. households own a dog. In a random sample of 402 U.S. households, 155say they own a dog. At α=0.01, is there enough evidence to support the society's claim? (a) Write the claim mathematically and identify H0 and Ha. (b) Find the critical value(s) and identify the rejection region(s). (c) Find the standardized test statistic. (d) Decide whether to reject or fail to reject the null hypothesis, and (e) interpret the decision in the context of the original claim.


