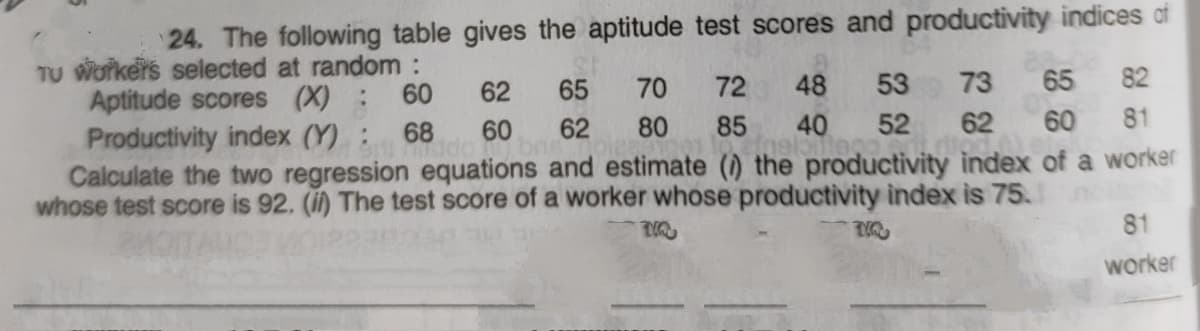
24. The following table gives the aptitude test scores and productivity indices af TU Workers selected at random : Aptitude scores (X) : Productivity index (Y): Calculate the two regression equations and estimate () the productivity index of a worker whose test score is 92. (i) The test score of a worker whose productivity index is 75. 60 62 65 70 72 48 53 73 65 82 68 60 62 80 85 40 52 62 60 81 81 worker


Q: For a certain data set the regression equation is ý-29-5x. The correlation coefficient between y and…
A: Coefficient of correlation
Q: Suppose a study wants to predict the market price of a certain species of turtle (Y) based on the…
A:
Q: The following table indicates the ages of a sample of female employees of People Plus Pty, and the…
A: The data shows the ages of a sample of female employees of people plus Pty, and the corresponding…
Q: 14. Consider the following regression equation: Y = 30 - 9X. If SSE = 600 and SS Total = 1,200, then…
A: The square of correlation coefficient is computed by r2=1-SSESST, where SSE is the error sum of…
Q: A sample of sunshine (x) in percent and temperature in O Fahrenheit (y) is recorded below to perform…
A:
Q: predicted IQ of the twin born second, given that the twin born first has an IQ of 107? What does the…
A:
Q: he following table gives information on the amount of sugar (in grams) and the calorie count in one…
A: Given data, X Y X*Y X*X 6 120 720 36 15 200 3000 225 12 150 1800 144 11 110 1210 121 8…
Q: The number of initial public offerings of stock issued in a 10-year period and the total proceeds of…
A: Step-by-step procedure to find the 95% prediction interval for the proceeds when the number of…
Q: 3. The equations of two regression lines obtained in a correlation analysis of 60 observations are…
A:
Q: The following table gives information on the amount of sugar (in grams) and the calorie count in one…
A: Given regression equation is y=79.555+5.631x If x=15 then y=?
Q: 1. Show that the following relationship on the simple linear regression class notebook is true: E,…
A:
Q: The following table shows the mass of an object recorded over time. Time (min) Mass (g) 19 30 24…
A:
Q: 1. Suppose that the sales of a company (Y) is regressed on advertising expenditure (x) and labor…
A: Here the Regression equation is provided as : sales of a company (Y) advertising expenditure (x)…
Q: If we collect monthly sales over two years for N=100 stores, we should not apply a simple linear…
A: If we collect monthly sales over two years for N=100 stores, we should not apply a simple linear…
Q: 1.Consider the following two simple regression models : Model I : Y, = B, + B,X; + µ, Model II : Y,…
A: Hello! As you have posted more than 3 sub parts, we are answering the first 3 sub-parts. In case…
Q: The following table shows the annual number of PhD graduates in a country in various fields.…
A: Excel output:
Q: Suppose that Y is normal and we have three explanatory unknowns which are also normal, and we have…
A: SOLUTION:- Given SSR=85000 SSE=15000
Q: The following table shows data for the cost of natural gas in Maryland (in dollars per Million Btu)…
A: a). Here, the price can be predicted using the year. Therefore, the price is the response variable…
Q: A random sample of nonindustrialized countries was selected, and the life expectancy in years is…
A: Given : r = -0.003 α = 0.05 n = 6 Hypothesis : H0 : ρ = 0 H0 : ρ ≠ 0 Test statistic, t = r×n-21-r2…
Q: )Suppose that Y is normal and we have three explanatory unknowns which are also normal, and we have…
A: There are 11 members and 3 explanatory variables. Thus, n=11 and k=3. It is given that SSR=86,000…
Q: The number of initial public offerings of stock issued in a 10-year period and the total proceeds of…
A: Given Information:
Q: o a computer using linear regression software and the output summary tells us that R-square is 0.79,…
A:
Q: an Pizza restaurant chain wants to understan monthly sales of deep-dish pizzas at his resta lata are…
A: outlet number Quantity sold Average price advertising expence disposable income 1 85300 10.14…
Q: I have some doubts regarding linear regression. if any 2 variables in X1, X2 AND Y have a positive…
A: Given: The linear regression model, y=b0+b1x1+b2x2+e
Q: n are five observations collected in a regression study on two variables. xi 2 6 9 13 20 yi…
A: a) In this case x is the independent variable and y is the dependent variable.
Q: 5.) The owner of Showtime Movie Theaters, Inc., would like to predict weekly gross revenue as a…
A: The weekly gross revenue is the dependent variable (y). a. The estimated regression equation with…
Q: Suppose that Y is normal and we have three explanatory unknowns which are also normal, and we have…
A: Solution
Q: A researcher collected statistics on the sales amount of a product in 120 different markets and the…
A: Any regression equation can be written in the form, Y = f(x1, x2,......,xn) + error . Here, y is…
Q: 7) The following chart shows the distance from New City and the median housing prices in those…
A: Given: Distance from New City (x) Median home price (y) 12 390 15 400 28 310 20 290 5…
Q: In a multiple regression problem involving two independent variables, if b1 is computed to be +2.0,…
A:
Q: The following table gives the data for the average temperature and the snow accumulation in several…
A: Use the Excel and Perform the Regression. Followings are the Steps to perform the Regression 1) Open…
Q: The table below shows the number of state-registered automatic weapons and the murder rate for…
A: In this case thousands of automatic weapons (x) is the independent variable and murders per 100,000…
Q: 15.23. You are given the following observations on X and Y 1 3 8 Y 1 3 2 5 4 Using linear regression…
A:
Q: The following table gives the yearly income (in thousands of dollars) of a large corporation for the…
A:
Q: The table below shows the number of state-registered automatic weapons and the murder rate for…
A: From given data, X Y X*Y X*X 11.3 13.9 157.07 127.69 8.2 10.7 87.74 67.24 7.1 10.3 73.13…
Q: 1. Consider the following regression model: Fram Risk Score; = Bo + B1 × Health Insurance; + ui The…
A: Given information: The regression model is given.
Q: The annual energy consumption in billions of Btu for both natural gas and coal is shown for a random…
A: Given that Using Excel regression
Q: 6.In simple linear regression, the sample correlation coefficient between the input variable and the…
A: Answer : Option A
Q: The following table shows the annual number of PhD graduates in a country in various fields. Natural…
A: Solution A
Q: Suppose that you run a correlation and find the correlation coefficient is 0.421 and the regression…
A: The correlation coefficient is 0.421 and the critical value is 0.396.
Q: 17) Suppose that Y is normal and we have three explanatory unknowns which are also normal, and we…
A:
Q: Consider the following population linear regression model of individual food expenditure: Y = 50 +…
A:
Q: The following table gives information on the amount of sugar (in grams) and the calorie count in one…
A: Given Regression equation is y=97.555+4.730x If x=54 y=?
Q: The following table shows the annual number of PhD graduates in a country in various fields.…
A: Given : Data represents the annual number of PhD graduates in a country in various fields. In…
Q: The table below shows the number of state-registered automatic weapons and the murder rate for…
A: x y xy x2 11.7 13.8 161.46 136.89 8.1 10.7 86.67 65.61 6.7 9.9 66.33 44.89 3.3 6.6…
Q: Which of the following statements is true with respect to a simple linear regression model? The…
A: We need to identify correct statements using concept of Simple linear regression
Q: Suppose we want to predict job performance of mechanics based on mechanical aptitude test scores and…
A: Given, Y X1 X2 1 40 25 2 45 20 1 38 30 3 50 30 2 48 28 3 55 30 3 53 34 4 55 36…
Q: 6, Given are five observations collected in a regression study on two variables. 2. 13 20 19 8. 27…
A: Given observation and Calculation x y x2 y2 xy 2 7 4 49 14 6 19 36 361 114 9 8 81 64 72…
Q: Suppose that Y is normal and we have three explanatory unknowns which are also normal, and we have…
A: Formula : Degree of freedom : df = n-4

Step by step
Solved in 2 steps with 2 images

- Olympic Pole Vault The graph in Figure 7 indicates that in recent years the winning Olympic men’s pole vault height has fallen below the value predicted by the regression line in Example 2. This might have occurred because when the pole vault was a new event there was much room for improvement in vaulters’ performances, whereas now even the best training can produce only incremental advances. Let’s see whether concentrating on more recent results gives a better predictor of future records. (a) Use the data in Table 2 (page 176) to complete the table of winning pole vault heights shown in the margin. (Note that we are using x=0 to correspond to the year 1972, where this restricted data set begins.) (b) Find the regression line for the data in part ‚(a). (c) Plot the data and the regression line on the same axes. Does the regression line seem to provide a good model for the data? (d) What does the regression line predict as the winning pole vault height for the 2012 Olympics? Compare this predicted value to the actual 2012 winning height of 5.97 m, as described on page 177. Has this new regression line provided a better prediction than the line in Example 2?17) Suppose that Y is normal and we have three explanatory unknowns which are also normal, and we have an independent random sample of 41 members of the population, where for each member, the value of Y as well as the values of the three explanatory unknowns were observed. The data is entered into a computer using linear regression software and the output summary tells us that R-square is 0.9, the linear model coefficient of the first explanatory unknown is 7 with standard error estimate 2.5, the coefficient for the second explanatory unknown is 11 with standard error 2, and the coefficient for the third explanatory unknown is 15 with standard error 4. The regression intercept is reported as 28. The sum of squares in regression (SSR) is reported as 90000 and the sum of squared errors (SSE) is 10000. From this information, what is the number of degrees of freedom for the t-distribution used to compute critical values for hypothesis tests and confidence intervals for the individual…9)Suppose that Y is normal and we have three explanatory unknowns which are also normal, and we have an independent random sample of 11 members of the population, where for each member, the value of Y as well as the values of the three explanatory unknowns were observed. The data is entered into a computer using linear regression software and the output summary tells us that R-square is 0.79, the linear model coefficient of the first explanatory unknown is 7 with standard error estimate 2.5, the coefficient for the second explanatory unknown is 11 with standard error 2, and the coefficient for the third explanatory unknown is 15 with standard error 4. The regression intercept is reported as 28. The sum of squares in regression (SSR) is reported as 79000 and the sum of squared errors (SSE) is 21000. From this information, what is the adjusted R-square? .8 .7 NONE OF THE OTHERS .6 .5
- 8)Suppose that Y is normal and we have three explanatory unknowns which are also normal, and we have an independent random sample of 11 members of the population, where for each member, the value of Y as well as the values of the three explanatory unknowns were observed. The data is entered into a computer using linear regression software and the output summary tells us that R-square is 0.86, the linear model coefficient of the first explanatory unknown is 7 with standard error estimate 2.5, the coefficient for the second explanatory unknown is 11 with standard error 2, and the coefficient for the third explanatory unknown is 15 with standard error 4. The regression intercept is reported as 28. The sum of squares in regression (SSR) is reported as 86000 and the sum of squared errors (SSE) is 14000. From this information, what is MSE/MST? .5000 NONE OF THE OTHERS .2000 .3000 .40005.- The following sample represents the two data on chlorine residues (in part per million) in a swimming pool at various times (hours) after the water has been treated with chemicals. Time X024681012 Waste And2.21.81.51.41.11.10.9 a) Calculate a linear regression model for this data. b) Use the model to estimate the chlorine residue in the pool 8 hours after treating it with chemicals. Why is your answer somewhat different than the 1.1 parts per million that was actually observed at 8 hours?If other factors are held constant and the Pearson correlation value between X and Y is r = 0.80, then the regression equation will tend to produce more accurate predictions than would be obtained if the Pearson correlation value was r = 0.60. True or False
- 24) If the R-square value for a simple linear regression model is 0.80 and the regression line has anegative slope, the correlation coefficient describing the relationship between the two variables is_____________.The following table shows the annual number of PhD graduates in a country in various fields. NaturalSciences Engineering SocialSciences Education 1990 70 10 70 30 1995 130 40 110 50 2000 330 130 280 140 2005 490 370 460 210 2010 590 550 830 520 2012 690 590 1,000 900 (a) With x = the number of social science doctorates and y = the number of education doctorates, use technology to obtain the regression equation. (Round coefficients to three significant digits.) y(x) = Graph the associated points and regression line. (b) What does the slope tell you about the relationship between the number of social science doctorates and the number of education doctorates? The slope tells us the increase in the number of social science doctorates for each additional education doctorate.The slope tells us the increase in the number of education doctorates for each additional social science doctorate. The slope tells us the decrease in the number…The following table shows the annual number of PhD graduates in a country in various fields. NaturalSciences Engineering SocialSciences Education 1990 70 10 60 30 1995 130 40 120 50 2000 330 130 280 140 2005 490 370 460 210 2010 590 550 830 520 2012 690 590 1,000 900 (a) With x = the number of social science doctorates and y = the number of education doctorates, use technology to obtain the regression equation. (Round coefficients to three significant digits.) y(x) = Graph the associated points and regression line. (b) What does the slope tell you about the relationship between the number of social science doctorates and the number of education doctorates? The slope tells us the increase in the number of education doctorates for each additional social science doctorate.The slope tells us the decrease in the number of education doctorates for each additional social science doctorate. The slope tells us the increase in the number…
- If a sample of 25 pairs of data yields a correlation coefficient, r, of 0.390 and the scatterplot displays a linear trend, can you use the regression equation to make predictions, assuming your x-values are within the domain of the data set? Choose your answer from the multiple choice answers below A.) Yes, because rcrit = 0.396 and the regression coefficient, r, is less than this value. B.) Yes, because rcrit = 0.381 and the regression coefficient, r, is greater than this value. C.) No, because rcrit = 0.381 and the regression coefficient, r, is greater than this value. D.) No, because rcrit = 0.396 and the regression coefficient, r, is less than this value.If x and y in a regression model are totally unrelated, _______. the coefficient of determination would be 0 the MSE would be 0s the SSE would be 0 the correlation coefficient would be -1 the coefficient of determination would be 1The owner of Original Italian Pizza restaurant chain wants to understand which variable most strongly influences the sales of his specialty deep-dish pizza. He has gathered data on the monthly sales of deep-dish pizzas at his restaurants and observations on other potentially relevant variables for each of several outlets in central Indiana. These data are provided in the file P10_04.xlsx. Estimate a simple linear regression equation between the quantity sold (Y) and each of the following candidates for the best explanatory variable: average price of deep-dish pizzas (X1), monthly advertising expenditures (X2), and disposable income per household in the areas surrounding the outlets (X3). Round your answers for intercept coefficients to the nearest whole number and slope coefficients to two decimal places, if necessary. If your answer is negative number, enter "minus" sign.