The following table shows the annual number of PhD graduates in a country in various fields. Natural Sciences Social Sciences Engineering Education 1990 70 10 60 30 1995 130 40 100 50 2000 330 130 280 130 2005 490 370 460 210 2010 590 550 830 520 2012 690 590 1,000 900 (a) With x= the number of social science doctorates and y = the number of education doctorates, use technology to obtain the regression equation. (Round coefficients to three significant digits.) y(x) - Graph the associated points and regression line. 1000 1000 1000 1000 800f 800f 800f 800f 6o0 60 400 400 400 400 200 200 200 200 200 400 600 B00 1000 200 400 600 B00 100 200 400 600 B00 1000 200 400 600 B00 1000 (b) What does the slope tell you about the relationship between the number of social science doctorates and the number of education doctorates? The slope tells us the increase in the number of education doctorates for each additional social science doctorate. The slope tells us the increase in the number of social science doctorates for each additional education doctorate. The slope tells us the decrease in the number of social science doctorates for each additional education doctorate. The slope tells us the decrease in the number of education doctorates for each additional social science doctorate. (c) Use technology to obtain the coefficient of correlation r. (Round your answer to three decimal places.) Does the value of r suggest a strong correlation between x and y? Since r is close to 0, the correlation between x and y is a strong one. Since r is close to 0, the correlation between x and y is a weak one. Since r is close to 1, the correlation between x and y is a strong one. Since r is close to 1, the correlation between x and y is a weak one. (d) Does the graph suggest a roughly linear relationship between x and y? Why or why not? No, the graph suggests a concave-down curve rather than a straight line. Yes, the graph suggests a straight line. Yes, the graph suggests a concave-down curve rather than a straight line. Yes, the graph suggests a concave-up curve rather than a straight line. No, the graph suggests a concave-up curve rather than a straight line.
The following table shows the annual number of PhD graduates in a country in various fields. Natural Sciences Social Sciences Engineering Education 1990 70 10 60 30 1995 130 40 100 50 2000 330 130 280 130 2005 490 370 460 210 2010 590 550 830 520 2012 690 590 1,000 900 (a) With x= the number of social science doctorates and y = the number of education doctorates, use technology to obtain the regression equation. (Round coefficients to three significant digits.) y(x) - Graph the associated points and regression line. 1000 1000 1000 1000 800f 800f 800f 800f 6o0 60 400 400 400 400 200 200 200 200 200 400 600 B00 1000 200 400 600 B00 100 200 400 600 B00 1000 200 400 600 B00 1000 (b) What does the slope tell you about the relationship between the number of social science doctorates and the number of education doctorates? The slope tells us the increase in the number of education doctorates for each additional social science doctorate. The slope tells us the increase in the number of social science doctorates for each additional education doctorate. The slope tells us the decrease in the number of social science doctorates for each additional education doctorate. The slope tells us the decrease in the number of education doctorates for each additional social science doctorate. (c) Use technology to obtain the coefficient of correlation r. (Round your answer to three decimal places.) Does the value of r suggest a strong correlation between x and y? Since r is close to 0, the correlation between x and y is a strong one. Since r is close to 0, the correlation between x and y is a weak one. Since r is close to 1, the correlation between x and y is a strong one. Since r is close to 1, the correlation between x and y is a weak one. (d) Does the graph suggest a roughly linear relationship between x and y? Why or why not? No, the graph suggests a concave-down curve rather than a straight line. Yes, the graph suggests a straight line. Yes, the graph suggests a concave-down curve rather than a straight line. Yes, the graph suggests a concave-up curve rather than a straight line. No, the graph suggests a concave-up curve rather than a straight line.

College Algebra
7th Edition
ISBN:9781305115545
Author:James Stewart, Lothar Redlin, Saleem Watson
Publisher:James Stewart, Lothar Redlin, Saleem Watson
Chapter1: Equations And Graphs
Section: Chapter Questions
Problem 10T: Olympic Pole Vault The graph in Figure 7 indicates that in recent years the winning Olympic men’s...

Related questions

Topic Video
Question
Help me to solve this problem please. Thank You
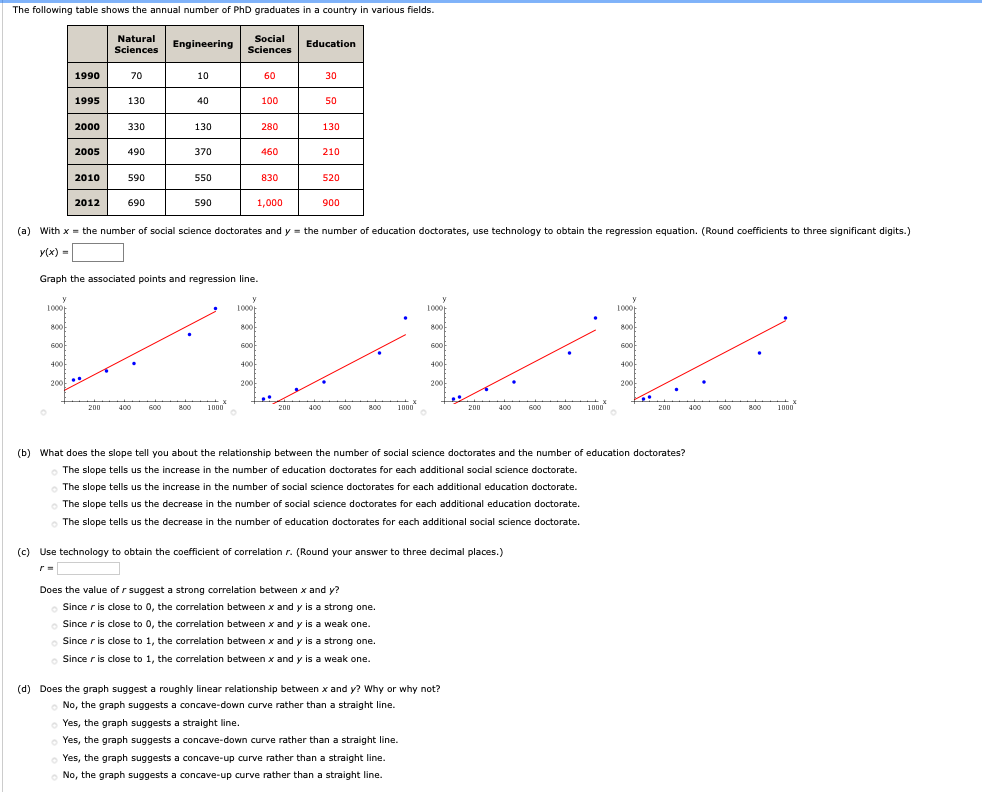
Transcribed Image Text:The following table shows the annual number of PhD graduates in a country in various fields.
Natural
Sciences
Social
Sciences
Engineering
Education
1990
70
10
60
30
1995
130
40
100
50
2000
330
130
280
130
2005
490
370
460
210
2010
590
550
830
520
2012
690
590
1,000
900
(a) With x= the number of social science doctorates and y = the number of education doctorates, use technology to obtain the regression equation. (Round coefficients to three significant digits.)
y(x) -
Graph the associated points and regression line.
1000
1000
1000
1000
800f
800f
800f
800f
6o0
60
400
400
400
400
200
200
200
200
200
400
600
B00
1000
200
400
600
B00
100
200
400
600
B00
1000
200
400
600
B00
1000
(b) What does the slope tell you about the relationship between the number of social science doctorates and the number of education doctorates?
The slope tells us the increase in the number of education doctorates for each additional social science doctorate.
The slope tells us the increase in the number of social science doctorates for each additional education doctorate.
The slope tells us the decrease in the number of social science doctorates for each additional education doctorate.
The slope tells us the decrease in the number of education doctorates for each additional social science doctorate.
(c) Use technology to obtain the coefficient of correlation r. (Round your answer to three decimal places.)
Does the value of r suggest a strong correlation between x and y?
Since r is close to 0, the correlation between x and y is a strong one.
Since r is close to 0, the correlation between x and y is a weak one.
Since r is close to 1, the correlation between x and y is a strong one.
Since r is close to 1, the correlation between x and y is a weak one.
(d) Does the graph suggest a roughly linear relationship between x and y? Why or why not?
No, the graph suggests a concave-down curve rather than a straight line.
Yes, the graph suggests a straight line.
Yes, the graph suggests a concave-down curve rather than a straight line.
Yes, the graph suggests a concave-up curve rather than a straight line.
No, the graph suggests a concave-up curve rather than a straight line.
Expert Solution
This question has been solved!
Explore an expertly crafted, step-by-step solution for a thorough understanding of key concepts.

This is a popular solution!

Trending now
This is a popular solution!

Step by step
Solved in 5 steps with 4 images

Knowledge Booster


Learn more about
Need a deep-dive on the concept behind this application? Look no further. Learn more about this topic, statistics and related others by exploring similar questions and additional content below.Recommended textbooks for you
College Algebra
Algebra
ISBN:
9781305115545
Author:
James Stewart, Lothar Redlin, Saleem Watson
Publisher:
Cengage Learning

Algebra & Trigonometry with Analytic Geometry
Algebra
ISBN:
9781133382119
Author:
Swokowski
Publisher:
Cengage

Algebra and Trigonometry (MindTap Course List)
Algebra
ISBN:
9781305071742
Author:
James Stewart, Lothar Redlin, Saleem Watson
Publisher:
Cengage Learning
College Algebra
Algebra
ISBN:
9781305115545
Author:
James Stewart, Lothar Redlin, Saleem Watson
Publisher:
Cengage Learning
Algebra & Trigonometry with Analytic Geometry
Algebra
ISBN:
9781133382119
Author:
Swokowski
Publisher:
Cengage
Algebra and Trigonometry (MindTap Course List)
Algebra
ISBN:
9781305071742
Author:
James Stewart, Lothar Redlin, Saleem Watson
Publisher:
Cengage Learning

Trigonometry (MindTap Course List)
Trigonometry
ISBN:
9781305652224
Author:
Charles P. McKeague, Mark D. Turner
Publisher:
Cengage Learning


Glencoe Algebra 1, Student Edition, 9780079039897…
Algebra
ISBN:
9780079039897
Author:
Carter
Publisher:
McGraw Hill