25) The following bar chart for these data shows Bar Chart of Number of Cosumers 160 140 120 100 00 60 40 Olmpus other br ndi Sonv Cyber Kodak- Shot Canon Penta Eay She Power Shet Brand 4) the marginal distribution of brands 3) the conditional distribution of brands. ) the marginal distribution of gender. ) the conditional distribution of gender. O the relative frequency of brands.
25) The following bar chart for these data shows Bar Chart of Number of Cosumers 160 140 120 100 00 60 40 Olmpus other br ndi Sonv Cyber Kodak- Shot Canon Penta Eay She Power Shet Brand 4) the marginal distribution of brands 3) the conditional distribution of brands. ) the marginal distribution of gender. ) the conditional distribution of gender. O the relative frequency of brands.

MATLAB: An Introduction with Applications
6th Edition
ISBN:9781119256830
Author:Amos Gilat
Publisher:Amos Gilat
Chapter1: Starting With Matlab
Section: Chapter Questions
Problem 1P

Related questions
Question
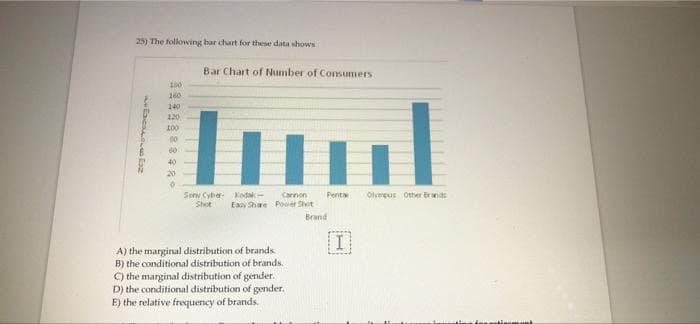
Transcribed Image Text:25) The following bar chart for these data shows
Bar Chart of Number of Cosumers
160
140
120
100
00
60
40
20
Sonv Cybe Koda-
Shot
Carnon
Penta
Olmpus Other Erands
Eay She Poier Shot
Brand
I
A) the marginal distribution of brands
B) the conditional distribution of brands.
C) the marginal distribution of gender.
D) the conditional distribution of gender.
E) the relative frequency of brands.
Expert Solution
This question has been solved!
Explore an expertly crafted, step-by-step solution for a thorough understanding of key concepts.

Step by step
Solved in 2 steps

Recommended textbooks for you
MATLAB: An Introduction with Applications
Statistics
ISBN:
9781119256830
Author:
Amos Gilat
Publisher:
John Wiley & Sons Inc

Probability and Statistics for Engineering and th…
Statistics
ISBN:
9781305251809
Author:
Jay L. Devore
Publisher:
Cengage Learning

Statistics for The Behavioral Sciences (MindTap C…
Statistics
ISBN:
9781305504912
Author:
Frederick J Gravetter, Larry B. Wallnau
Publisher:
Cengage Learning
MATLAB: An Introduction with Applications
Statistics
ISBN:
9781119256830
Author:
Amos Gilat
Publisher:
John Wiley & Sons Inc
Probability and Statistics for Engineering and th…
Statistics
ISBN:
9781305251809
Author:
Jay L. Devore
Publisher:
Cengage Learning
Statistics for The Behavioral Sciences (MindTap C…
Statistics
ISBN:
9781305504912
Author:
Frederick J Gravetter, Larry B. Wallnau
Publisher:
Cengage Learning

Elementary Statistics: Picturing the World (7th E…
Statistics
ISBN:
9780134683416
Author:
Ron Larson, Betsy Farber
Publisher:
PEARSON

The Basic Practice of Statistics
Statistics
ISBN:
9781319042578
Author:
David S. Moore, William I. Notz, Michael A. Fligner
Publisher:
W. H. Freeman

Introduction to the Practice of Statistics
Statistics
ISBN:
9781319013387
Author:
David S. Moore, George P. McCabe, Bruce A. Craig
Publisher:
W. H. Freeman