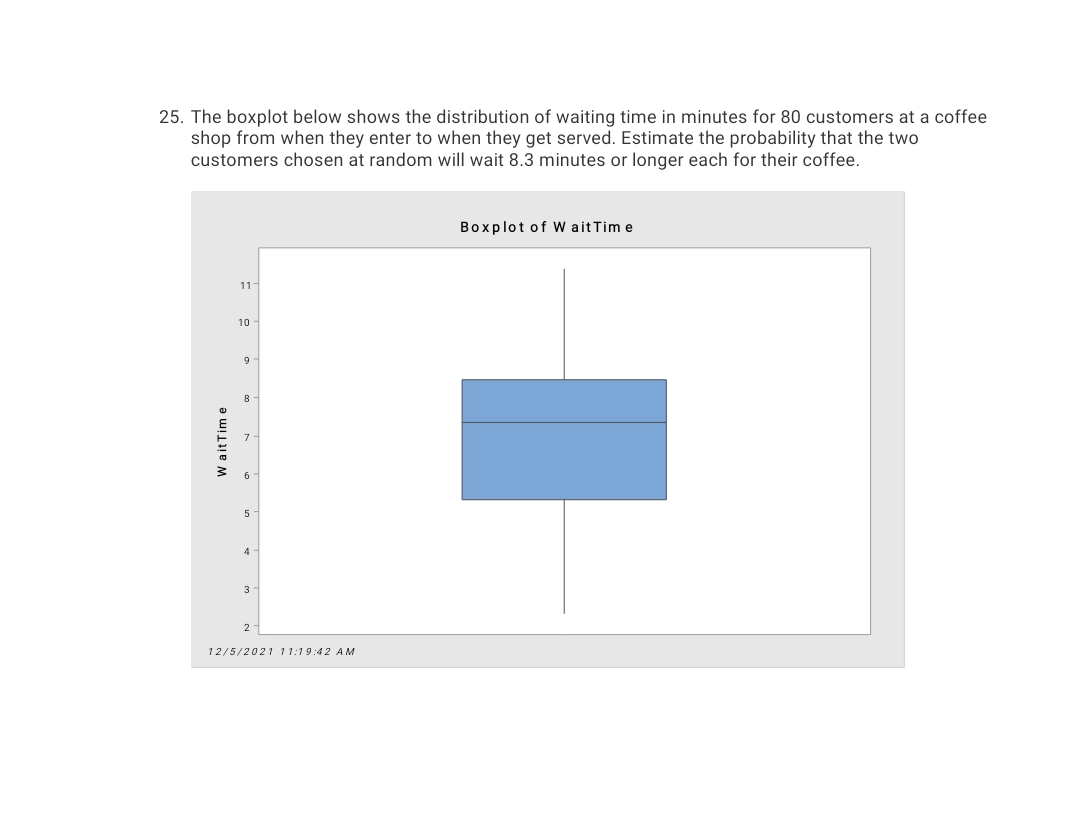
25. The boxplot below shows the distribution of waiting time in minutes for 80 customers at a coffee shop from when they enter to when they get served. Estimate the probability that the two customers chosen at random will wait 8.3 minutes or longer each for their coffee. Boxplot of W ait Tim e 11 10 9. 8 7 4 3 2 12/5/2021 11:19:42 AM W aitTim e
25. The boxplot below shows the distribution of waiting time in minutes for 80 customers at a coffee shop from when they enter to when they get served. Estimate the probability that the two customers chosen at random will wait 8.3 minutes or longer each for their coffee. Boxplot of W ait Tim e 11 10 9. 8 7 4 3 2 12/5/2021 11:19:42 AM W aitTim e

Chapter8: Sequences, Series,and Probability
Section8.7: Probability
Problem 11ECP: A manufacturer has determined that a machine averages one faulty unit for every 500 it produces....

Related questions
Question
25
Transcribed Image Text:25. The boxplot below shows the distribution of waiting time in minutes for 80 customers at a coffee
shop from when they enter to when they get served. Estimate the probability that the two
customers chosen at random will wait 8.3 minutes or longer each for their coffee.
Boxplot of W aitTim e
11
10
9
5
4
3
2-
12/5/2021 11:19:42 AM
W ait Tim e
Expert Solution
This question has been solved!
Explore an expertly crafted, step-by-step solution for a thorough understanding of key concepts.

This is a popular solution!

Trending now
This is a popular solution!

Step by step
Solved in 2 steps

Recommended textbooks for you