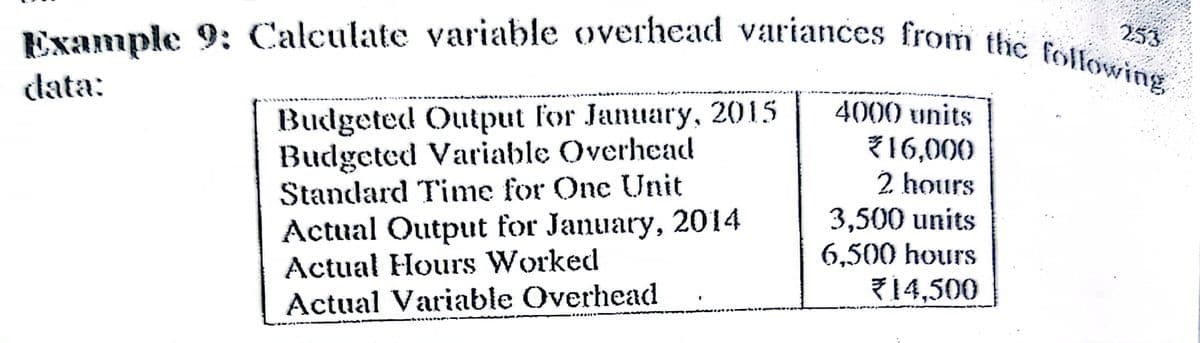
253 Example 9: Calculate variable overhead variances from the following data: 4000 units BudneteL Output for January. 2015


Q: A case-control (or retrospective) study was conducted to investigate a relationship between the…
A: There are two categorical variables which are injuries and helmet color. Injuries has 2 cases,…
Q: Example 9: What is the portfolio standard deviation for a two-asset portfolio comprised of the…
A:
Q: Question 1 The time taken to complete a puzzle by 40 first graders was recorded below Time (mins)…
A:
Q: Example 14.5 Consider H,: H1 = Hz = H3= H4= H5 (a) Complete the following ANOVA table. Mean Squares…
A:
Q: The following are 10 employee salaries from a company of 500 employees. Calculate the variance of…
A: Reviewing information, X : Employee Salaries n=10…
Q: In an analysis of variance, differences between participants contribute to which of the following…
A: Analysis of variance is given.
Q: 12. Find Coefficient of Variation (CV) for the following data. [Use population variance] X 5 - 10 4…
A: Given : X f 05-10 4 10-15 5 15-20 7 20-25 8 25-30 3
Q: Example 13.12 The divisional manager of a retail chain believes the average number of customers…
A:
Q: 2. A pet association claims that the mean annual costs of food for dogs and cats are the same. The…
A: Given that A pet association claims that the mean annual costs of food for dogs and cats are the…
Q: The following are 10 employee salaries from a company of 500 employees. Calculate the variance of…
A: We need to compute the variance . These are the sample data that have been provided: Salary…
Q: The number of employees, wages per employee and the variance of the wage per employee for two…
A:
Q: QUESTION 3 3.1 The net salaries of 12 mine workers are listed in the table below. R12 000 R13 000…
A: 3.1.1 : Data is numerical 3.1.2 : 19,000 is the supervisor's salary. Supervisor gets the highest…
Q: Question 10 A construction company is considering employing one of two training programs. Two groups…
A: Given:x1=32.11, s12=68.09x2=19.75, s22=71.14 Then,s1=68.09=8.25s2=71.14=8.43
Q: The data below shows the SAT scores of 30 students at Martin Luther King High School in Florida.…
A: One sample T test : The one-sample t-test may be a applied mathematics hypothesis take a look at…
Q: Problem # 4 Assume the following data obey the one-way analysis of variance model Treatment 1 13 8.…
A: The following table is obtained: Treatment 1 Treatment 2 Treatment 3 13 1 8 8 0 5…
Q: A set of 5 scores has SS = 20. If the scores are from a sample, the sample variance is ____. If the…
A: Given , Sample size n=5 and S.S = 20Sample variance = S.Sn-1=205-1=204=5∴ Sample…
Q: The management at Revelation Rehabilitation, a nursing and physical therapy care facility, are…
A: Solution-: Let, X=The numbers of hours each clinical staff member undergoes professional development…
Q: Suppose P(X E {1,2,3})=1 and E(X) =2.5. What is the smallest and largest possible values for the…
A: P(x=i) =pi where i = 1,2,3 Since P(X belongs to {1,2,3}), p1+p2+p3 = 1…
Q: Example 8. Present the data given below by suitable diagram. 2011 1000 Year: No. of students : 2010…
A:
Q: Assignment 4 FlyHigh Airlines determined that the distance travelled per aircraft per year is…
A: Given information- Population mean, µ = 60 thousand miles Population variance, σ2 = 100 So,…
Q: How to solve for question 2-4?
A: Question 2: Sample statistics of the two samples:The given statistics for the two randomly selected…
Q: 4.7.6 Given a normally distributed population with a mean of 75 and a variance of 625, find: (a)…
A: Given, Mean = 75 The objective is to find the required probabilities.
Q: Refer to Figure 1. The sample correlation coemicient equais Dependent Variable Independent Variable…
A: Given that,
Q: Question 2 One give you the distribution of all the shop turnovers of a large company in k€…
A: Formula Used: Mean = ∑FX∑F Wwhere F is the frequency and X is the mid-value Sample standard…
Q: Suppose that 67% of college students in Australia use more than 1.65 gigabytes of data on their…
A:
Q: Question 3 For the following data set, calculate the Variance 4 10 12 36
A: We have to find the variance.
Q: Some computer output for an analysis of variance test to compare means is given. Source Groups Error…
A: a) Number of groups in the given study: df for Groups=4 Number of groups-1=4 Number of groups=4+1=5…
Q: Question 1 The time taken to complete a puzzle by 40 first graders was recorded below Time (mins)…
A: Given that data I want to find mean median and variance Mean = sum of all observations/total…
Q: Given data points (2. -1). (2, 1). (3, 2). (0,- 1)and (3, -1). find the total variance of the data.
A: Given: Data : (2 , -1 ) , (2 , 1 ) , (3 , 2) , (0 , -1), (3,-1)
Q: Example 1 Construct a histogram for the following frequency distribution. С. .: Frequency: 10-20…
A:
Q: The number of employees, wages per employee and the variance of the wages per employee for two…
A:
Q: Example 4.6: Calculate the mean absolute deviation and its coefficient from median for the following…
A: For product A, arrange the data in ascending order. 23, 29, 38, 41, 53 For the odd number of…
Q: Discuss the following measures of variation in one or two sentences. 1) Range- 2) Standard…
A: The degree to which numerical data tend to spread about an average value is called the variation. A…
Q: PART 1 1. Consider the following data (volume in ml) 235; 272; 269; 251; 235; 246; 239; 265; 272;…
A: Hi! Thank you for the question, As per the honor code, we are allowed to answer three sub-parts at a…
Q: Histogram: fines paid by drivers 12 10 4. 1 2 3 More Number of fines paid a year by a driver Compute…
A:
Q: Calculate variance and co-efficient of variation from the following data: Class Interval : 12-16…
A: Class Frequency 12 - 16 2 16 - 20 8 20 - 24 18 24 - 28 10 28 - 32 6 32 - 36 5
Q: If Y is Normally distributed , and p(y 200 ) = 0.03 then the values of the mean and variance of Y ,…
A: Given : P(y < 170) = 0.14 P(y > 200) = 0.03 Y is normally distributed.
Q: X is a point estimator of: Select one: a. Population mean b. Sample mean c. Sample variance d.…
A:
Q: What is the variance of X in the following data? -2 | -1 | 0 | 1 | 2 | 3 -3 -1 -2 4 Select one: 17.5…
A:
Q: Exhibit 5-6Probability Distribution x f(x) 10 .2 20 .3 30 .4…
A: Given Data and calculation for variance
Q: If -7 is added to every observation in a set of data, what will happen to the variance? A. It will…
A: Variance is a statistical measure which tells the variability in that data. The variance has the…
Q: We are interested in determining whether or not the variances of the sales at two music stores (A…
A:
Q: Consider the following data: 8 P(X = x) 0.2 0.2 0.2 0.2 0.2 Step 2 of 5: Find the variance. Round…
A:
Q: If covariance between X and Y variables is 10 and the variances of X and Y are respectively 16 and…
A: The objective is to find correlation coefficient
Q: State whether the effect size for a 1-point effect (M- = 1) is small, medium or large given the…
A: Effect size is: Effect size=M-μσ=1σ
Q: Example 7.15 If B₁ = 1 and ₂ = 4 and variance = 9, find the values of H3 nature of the distribution.…
A:
Q: Example 5. Calculate Quartile Deviation and its Coefficient from the following data : Weight (in…
A: We have given that, The data set is, Weight (x) 120 122 124 126 130 140 150 160 Students (f)…
Q: The number of employees, wages per employee and the variance of the wages per employee for two…
A: Given The data is as follows: Factory A Factory B Number of employees 100 150 Average wages…
Q: QUESTION FIVE: a) Explain in general the importance of measures of central tendency, measures of…
A: Given information: Viewing Time (Minutes) Number of residents 300 to 399 14 400 to 499 46…

Step by step
Solved in 2 steps with 2 images

- Suppose these data show the number of gallons of gasoline sold by a gasoline distributor in Bennington, Vermont, over the past 12 weeks. Week Sales (1,000s of gallons) 1 18 2 22 3 20 4 24 5 19 6 16 7 21 8 19 9 22 10 20 11 15 12 23 (a) Compute four-week and five-week moving averages for the time series. Week Time Series Value 4-Week Moving Average Forecast 5-Week Moving Average Forecast 1 18 2 22 3 20 4 24 5 19 6 16 7 21 8 19 9 22 10 20 11 15 12 23 (b) Compute the MSE for the four-week moving average forecasts. (Round your answer to two decimal places.) Compute the MSE for the five-week moving average forecasts. (Round your answer to two decimal places.) (c) What appears to be the best number of weeks of past data (three, four, orCalculate Karl Pearson's coeffcient of skewness from the following data:Weekly Sales (Ksh) 10-12 12-14 14-16 16-18 18-20 20-22 22-24 24-26Number of Companies 12 18 35 42 50 30 8 4Suppose these data show the number of gallons of gasoline sold by a gasoline distributor in Bennington, Vermont, over the past 12 weeks. Week Sales (1,000sof gallons) 1 17 2 22 3 19 4 24 5 19 6 16 7 21 8 19 9 23 10 21 11 16 12 22 (a) Compute four-week and five-week moving averages for the time series. Week Time SeriesValue 4-WeekMovingAverageForecast 5-WeekMovingAverageForecast 1 17 2 22 3 19 4 24 5 19 6 16 7 21 8 19 9 23 10 21 11 16 12 22 (b) Compute the MSE for the four-week moving average forecasts. (Round your answer to two decimal places.) Compute the MSE for the five-week moving average forecasts. (Round your answer to two decimal places.) (c) What appears to be the best number of weeks of past data (three, four, or five) to use in the moving average computation? MSE for the three-week moving average is 11.15. Three weeks appears to be best, because the…
- Suppose that weights of college mathematics textbooks in the United States are normally distributed with mean µ = 2.25 lbs and variance σ2 = 0.2025 lbs. Find the weight that corresponds to Q3 and interpret this measure of position in the context of the problem.IOG Technologies offers semiconductor and system solutions for automotive industrial and multimarket sectors for applications in communication. The following data relates to the production of three products manufactured by them: Product Price (RM) Quantity 2000 2016 2000 2016 BD-1005 3.00 3.20 60 80 LCM-2134 2.00 2.50 100 90 DDK-456 3.50 4.00 500 700 Determine the Laspeyres Price Index (LPI) and Paasche Price Index (PPI) for 2016 using 2000 as the base period.Suppose these data show the number of gallons of gasoline sold by a gasoline distributor in Bennington, Vermont, over the past 12 weeks. Week Sales (1,000sof gallons) 1 18 2 21 3 20 4 24 5 19 6 16 7 20 8 18 9 22 10 21 11 15 12 23 (a) Compute four-week and five-week moving averages for the time series.4-week moving average forecast & 5 week moving average forecast (b) Compute the MSE for the four-week moving average forecasts. (Round your answer to two decimal places.) Compute the MSE for the five-week moving average forecasts. (Round your answer to two decimal places.) c) What appears to be the best number of weeks of past data (three, four, or five) to use in the moving average computation? MSE for the three-week moving average is 12.22. Three weeks appears to be best, because the three-week moving average provides the smallest MSE .Three weeks appears to be best, because the three-week moving average provides the largest MSE. Four weeks appears…
- The staff of controller of McCourt Company added the variable "pounds moved" to the ten-month data set: Month Materials Handling Cost Number of Moves Pounds Moved January $5,600 475 12,000 February 3,090 125 15,000 March 2,780 175 7,800 April 8,000 600 29,000 May 1,990 200 600 June 5,300 300 23,000 July 4,300 250 17,000 August 6,300 400 25,000 September 2,000 100 6,000 October 6,240 425 22,400 Required: 1. Using the data on material handling, use regression software such as Microsoft Excel to complete the missing data in the table below (round regression parameters to the nearest cent and other answers to three decimal places): McCourt CompanySUMMARY OUTPUT Regression Statistics Multiple R 0.999 R Square fill in the blank 491c8af8afe4f84_1 Adjusted R Square fill in the blank 491c8af8afe4f84_2 Standard Error 119.600 Observations 10 ANOVA df SS MS F Significance F Regression 2 37,768,070.16 18,884,035…Suppose that weights of college mathematics textbooks in the United States are normally distributed with mean µ = 1.25 lbs and variance σ2 = 0.25 lb2. Find the weight that corresponds to Q1 and interpret this measure of position in the context of the problem.D & R A1 10 - 3 Question 10. Minimum Variance Commodity Hedge Choc Full of Good Inc., a producer of powdered hot chocolate, has just received a large order that will require the purchase of 800 metric tons of cocoa in 3 months. The current spot price of cocoa is US $3,055 per metric ton. The standard deviation of the change in spot cocoa price is 0.2. Mr. Dulce, the CFO of Choc Full, is considering a minimum-variance hedge of this future cocoa purchase using the three-month cocoa futures contract. The contract size is 10 metric tons. The standard deviation of the change in cocoa futures price is 0.25. The covariance between the change in the spot and futures cocoa price is 0.035. The annually compounded interest rate faced by the company is 5%, the three-month storage cost is $2.5 per metric ton, and the convenience yield is $0.5 per metric ton. Compute the minimum-variance hedge ratio.
- D & R A1 10 - 7 Question 10. Minimum Variance Commodity Hedge Choc Full of Good Inc., a producer of powdered hot chocolate, has just received a large order that will require the purchase of 800 metric tons of cocoa in 3 months. The current spot price of cocoa is US $3,055 per metric ton. The standard deviation of the change in spot cocoa price is 0.2. Mr. Dulce, the CFO of Choc Full, is considering a minimum-variance hedge of this future cocoa purchase using the three-month cocoa futures contract. The contract size is 10 metric tons. The standard deviation of the change in cocoa futures price is 0.25. The covariance between the change in the spot and futures cocoa price is 0.035. The annually compounded interest rate faced by the company is 5%, the three-month storage cost is $2.5 per metric ton, and the convenience yield is $0.5 per metric ton. What is the correlation of the change in the spot and futures cocoa price?Amex PLC has gathered following information on the sales of face mask from April 2020 toSeptember 2020.Month Sales ($)April 17,000May 18,000June 19,500July 22,000August 21,000September 23,000You are required to;b. Calculate the forecasted sales difference if you use 3-period weighted moving averagedesigned with the following weights: July 0.2, August 0.3 and September 0.5.Suppose that index model for Stocks A and B is estimated from excess returns with the following results : Ra 0.04 +0.6Rm+ea , Rb = - 0.04 + 1.3Rm + eb Risk on the market is 30% , R-squared of A is 30%R - squared of B is 40% , security A residual variance is


