QUESTION FIVE: a) Explain in general the importance of measures of central tendency, measures of variation and measures of normality in business decision making. b) The table below shows the frequency distribution for the number of minutes per week spent watching TV by residents of Nyali in Mombasa. Viewing Time (minutes) 300-399 Number of Residents 14 400-499 46 500-599 58 600-699 76 700-799 68 800-899 62 900-999 48 1000-1099 22 1100- 1199 6. Total 400
QUESTION FIVE: a) Explain in general the importance of measures of central tendency, measures of variation and measures of normality in business decision making. b) The table below shows the frequency distribution for the number of minutes per week spent watching TV by residents of Nyali in Mombasa. Viewing Time (minutes) 300-399 Number of Residents 14 400-499 46 500-599 58 600-699 76 700-799 68 800-899 62 900-999 48 1000-1099 22 1100- 1199 6. Total 400

Functions and Change: A Modeling Approach to College Algebra (MindTap Course List)
6th Edition
ISBN:9781337111348
Author:Bruce Crauder, Benny Evans, Alan Noell
Publisher:Bruce Crauder, Benny Evans, Alan Noell
Chapter5: A Survey Of Other Common Functions
Section5.3: Modeling Data With Power Functions
Problem 6E: Urban Travel Times Population of cities and driving times are related, as shown in the accompanying...

Related questions
Question
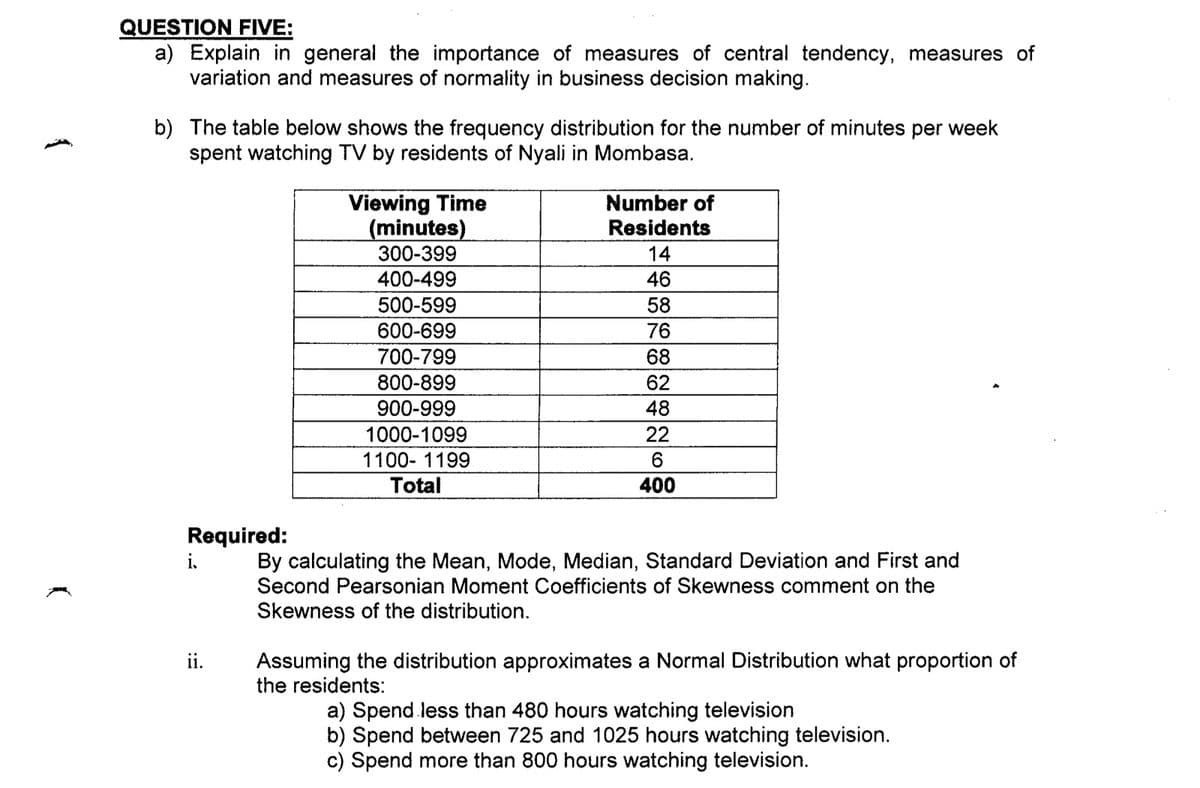
Transcribed Image Text:QUESTION FIVE:
a) Explain in general the importance of measures of central tendency, measures of
variation and measures of normality in business decision making.
b) The table below shows the frequency distribution for the number of minutes per week
spent watching TV by residents of Nyali in Mombasa.
Viewing Time
(minutes)
300-399
Number of
Residents
14
400-499
46
500-599
58
600-699
76
700-799
800-899
68
62
900-999
48
1000-1099
22
1100- 1199
6.
Total
400
Required:
By calculating the Mean, Mode, Median, Standard Deviation and First and
Second Pearsonian Moment Coefficients of Skewness comment on the
Skewness of the distribution.
Assuming the distribution approximates a Normal Distribution what proportion of
the residents:
ii.
a) Spend less than 480 hours watching television
b) Spend between 725 and 1025 hours watching television.
c) Spend more than 800 hours watching television.
Expert Solution
This question has been solved!
Explore an expertly crafted, step-by-step solution for a thorough understanding of key concepts.

Step by step
Solved in 4 steps

Recommended textbooks for you
Functions and Change: A Modeling Approach to Coll…
Algebra
ISBN:
9781337111348
Author:
Bruce Crauder, Benny Evans, Alan Noell
Publisher:
Cengage Learning

Glencoe Algebra 1, Student Edition, 9780079039897…
Algebra
ISBN:
9780079039897
Author:
Carter
Publisher:
McGraw Hill
Functions and Change: A Modeling Approach to Coll…
Algebra
ISBN:
9781337111348
Author:
Bruce Crauder, Benny Evans, Alan Noell
Publisher:
Cengage Learning
Glencoe Algebra 1, Student Edition, 9780079039897…
Algebra
ISBN:
9780079039897
Author:
Carter
Publisher:
McGraw Hill