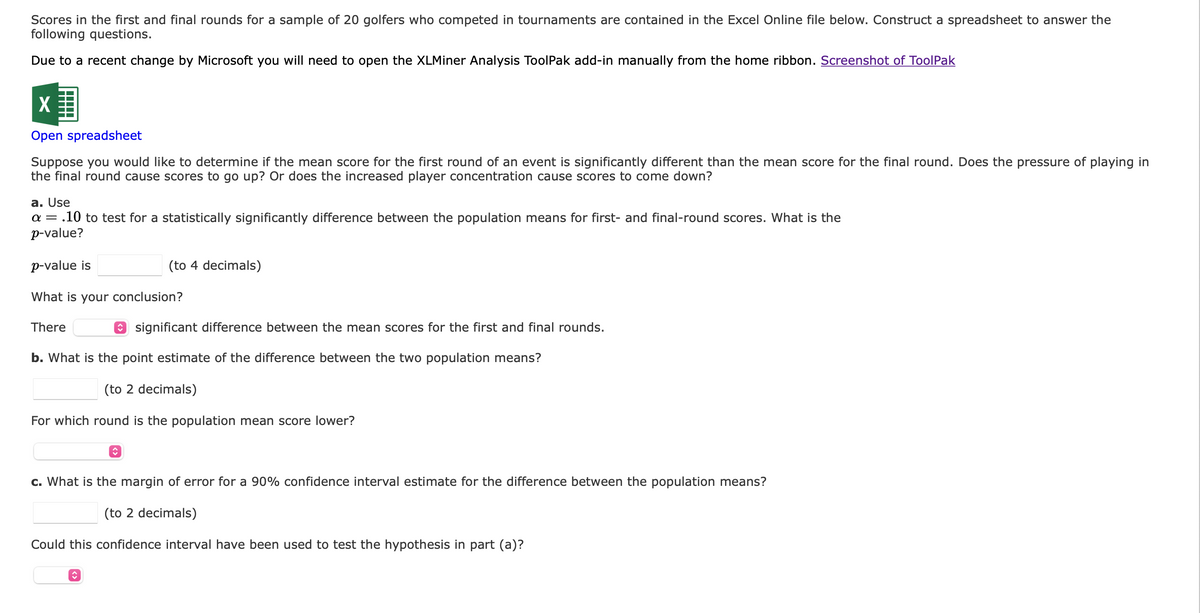
Scores in the first and final rounds for a sample of 20 golfers who competed in tournaments are contained in the Excel Online file below. Construct a spreadsheet to answer the following questions. Due to a recent change by Microsoft you will need to open the XLMiner Analysis ToolPak add-in manually from the home ribbon. Screenshot of ToolPak Open spreadsheet Suppose you would like to determine if the mean score for the first round of an event is significantly different than the mean score for the final round. Does the pressure of playing in the final round cause scores to go up? Or does the increased player concentration cause scores to come down? a. Use a = .10 to test for a statistically significantly difference between the population means for first- and final-round scores. What is the p-value? p-value is What is your conclusion? There (to 4 decimals) significant difference between the mean scores for the first and final rounds. b. What is the point estimate of the difference between the two population means? (to 2 decimals) For which round is the population mean score lower? Ⓒ c. What is the margin of error for a 90% confidence interval estimate for the difference between the population means? (to 2 decimals) Could this confidence interval have been used to test the hypothesis in part (a)? 0
Scores in the first and final rounds for a sample of 20 golfers who competed in tournaments are contained in the Excel Online file below. Construct a spreadsheet to answer the following questions. Due to a recent change by Microsoft you will need to open the XLMiner Analysis ToolPak add-in manually from the home ribbon. Screenshot of ToolPak Open spreadsheet Suppose you would like to determine if the mean score for the first round of an event is significantly different than the mean score for the final round. Does the pressure of playing in the final round cause scores to go up? Or does the increased player concentration cause scores to come down? a. Use a = .10 to test for a statistically significantly difference between the population means for first- and final-round scores. What is the p-value? p-value is What is your conclusion? There (to 4 decimals) significant difference between the mean scores for the first and final rounds. b. What is the point estimate of the difference between the two population means? (to 2 decimals) For which round is the population mean score lower? Ⓒ c. What is the margin of error for a 90% confidence interval estimate for the difference between the population means? (to 2 decimals) Could this confidence interval have been used to test the hypothesis in part (a)? 0

Glencoe Algebra 1, Student Edition, 9780079039897, 0079039898, 2018
18th Edition
ISBN:9780079039897
Author:Carter
Publisher:Carter
Chapter10: Statistics
Section10.5: Comparing Sets Of Data
Problem 3BGP

Related questions
Question
100%
please help asap i will upvote!!

Transcribed Image Text:5
F2
496AWN -
2
3
File
5
Home
A
Player
Michael Letzig
Scott Verplank
D.A. Points
Jerry Kelly
Soren Hansen
D.J. Trahan
Bubba Watson
Reteif Goosen
Jeff Klauk
7
8
9
10
11 Kenny Perry
12
Aron Price
13
Charles Howell
14 Jason Dufner
15
Mike Weir
16
Carl Pettersson
17
Bo Van Pelt
18 Ernie Els
19
Cameron Beckman
20
Nick Watney
21 Tommy Armour III
22
23
24
25
26
27
28
29
30
31
32
22
=
Insert
Data
Arial
B
First
Round
70
73
+
73
70
65
72
70
X ✓ fx After reading these instructions delete all text in this shaded area.
F
65
65
67
75
68
72
72
67
71
66
73
Draw
65
69
с
Final
Round
66 7 75 14 颌70728177 68 69 7 77 75 7 76
67
71
74
67
68
77
67
✓ 10
75
68
Page Layout
Calculation Mode: Automatic Workbook Statistics
V
B
D
Formulas
Differences
M
E
Data
Review
View
V
Part c
Margin of Error (to 2 decimals)
ab
Part b
Difference Between the Two Population
Means (to 2 decimals)
Help
G
General
Part a
After reading these instructions delete all text in this shaded area.
Use the XLMiner Analysis ToolPak to conduct your t-Test analysis.
After deleting all text in this shaded area, set the output range in
the ToolPak to the top left cell of this area (F2).
Your t-Test analysis output should fit into this shaded area.
H
←0
.00
Formula
.00
→.0
#N/A
#N/A
▬▬▬▬
V
J
K
Editing
Ev APV o
L
M
Give Feedback to Microsoft
Comments
N
100% +
Transcribed Image Text:Scores in the first and final rounds for a sample of 20 golfers who competed in tournaments are contained in the Excel Online file below. Construct a spreadsheet to answer the
following questions.
Due to a recent change by Microsoft you will need to open the XLMiner Analysis ToolPak add-in manually from the home ribbon. Screenshot of ToolPak
X
Open spreadsheet
Suppose you would like to determine if the mean score for the first round of an event is significantly different than the mean score for the final round. Does the pressure of playing in
the final round cause scores to go up? Or does the increased player concentration cause scores to come down?
a. Use
a = .10 to test for a statistically significantly difference between the population means for first- and final-round scores. What is the
p-value?
p-value is
What is your conclusion?
There
(to 4 decimals)
b. What is the point estimate of the difference between the two population means?
(to 2 decimals)
For which round is the population mean score lower?
î
ŵ
significant difference between the mean scores for the first and final rounds.
c. What is the margin of error for a 90% confidence interval estimate for the difference between the population means?
(to 2 decimals)
Could this confidence interval have been used to test the hypothesis in part (a)?
Expert Solution
This question has been solved!
Explore an expertly crafted, step-by-step solution for a thorough understanding of key concepts.

Step by step
Solved in 5 steps with 1 images

Recommended textbooks for you
Glencoe Algebra 1, Student Edition, 9780079039897…
Algebra
ISBN:
9780079039897
Author:
Carter
Publisher:
McGraw Hill

Glencoe Algebra 1, Student Edition, 9780079039897…
Algebra
ISBN:
9780079039897
Author:
Carter
Publisher:
McGraw Hill