At Westgate Community College, a survey was done to determine when students are available for class. A questionnaire was given to a random sample of students. The instructions were to mark each of the time categories in which they could take classes. Many students marked more than one category. Responses from the students in the sample indicated that 52 would take early morning classes, 85 would take mid-morning classes, 41 would take afternoon classes and 37 would take evening classes. Would a circle graph be appropriate for this data? Give a reason for your answer. O Yes. The categories represent all possible responses. O No. There are too few categories for a circle graph to be useful. Yes. Circle graphs are most effective when the number of wedges is 10 or fewer. No. Since there were multiple responses from some students this data does not represent parts of a whole. O Yes. Each category represents a percentage of the total student population that could attend class at a certain time.
At Westgate Community College, a survey was done to determine when students are available for class. A questionnaire was given to a random sample of students. The instructions were to mark each of the time categories in which they could take classes. Many students marked more than one category. Responses from the students in the sample indicated that 52 would take early morning classes, 85 would take mid-morning classes, 41 would take afternoon classes and 37 would take evening classes. Would a circle graph be appropriate for this data? Give a reason for your answer. O Yes. The categories represent all possible responses. O No. There are too few categories for a circle graph to be useful. Yes. Circle graphs are most effective when the number of wedges is 10 or fewer. No. Since there were multiple responses from some students this data does not represent parts of a whole. O Yes. Each category represents a percentage of the total student population that could attend class at a certain time.

Glencoe Algebra 1, Student Edition, 9780079039897, 0079039898, 2018
18th Edition
ISBN:9780079039897
Author:Carter
Publisher:Carter
Chapter10: Statistics
Section10.6: Summarizing Categorical Data
Problem 10CYU

Related questions
Question
Please answer this question quickly. Show work!
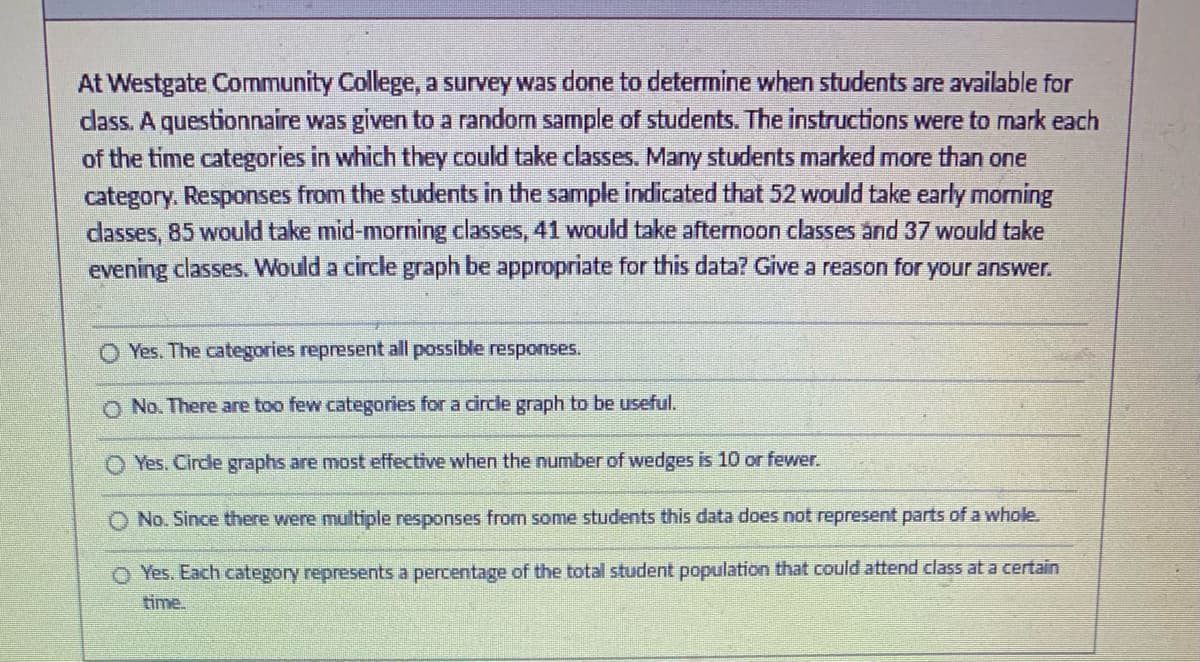
Transcribed Image Text:At Westgate Community College, a survey was done to determine when students are available for
class. A questionnaire was given to a random sample of students. The instructions were to mark each
of the time categories in which they could take classes. Many students marked more than one
category. Responses from the students in the sample indicated that 52 would take early morning
classes, 85 would take mid-morning classes, 41 would take afternoon classes and 37 would take
evening classes. Would a circle graph be appropriate for this data? Give a reason for your answer.
Yes. The categories represent all possible responses.
O No. There are too few categories for a circle graph to be useful.
Yes. Circle graphs are most effective when the number of wedges is 10 or fewer.
O No. Since there were multiple responses from some students this data does not represent parts of a whole.
OYes. Each category represents a percentage of the total student population that could attend class at a certain
time
Expert Solution
This question has been solved!
Explore an expertly crafted, step-by-step solution for a thorough understanding of key concepts.

Step by step
Solved in 3 steps

Recommended textbooks for you
Glencoe Algebra 1, Student Edition, 9780079039897…
Algebra
ISBN:
9780079039897
Author:
Carter
Publisher:
McGraw Hill

Holt Mcdougal Larson Pre-algebra: Student Edition…
Algebra
ISBN:
9780547587776
Author:
HOLT MCDOUGAL
Publisher:
HOLT MCDOUGAL
Glencoe Algebra 1, Student Edition, 9780079039897…
Algebra
ISBN:
9780079039897
Author:
Carter
Publisher:
McGraw Hill
Holt Mcdougal Larson Pre-algebra: Student Edition…
Algebra
ISBN:
9780547587776
Author:
HOLT MCDOUGAL
Publisher:
HOLT MCDOUGAL