3) Previous experience shows the variance of a given process to be 40. Process engineers are testing to determine whether this value has decreased. a) What is the appropriate null and alternate hypothesis to determine if the process variance has decreased? Ho:o² > 40 versus Ha:o² < 40 b) Choose a level of a. Use a = 0.05 for this problem. c) To test the hypothesis, the process engineers take a sample of 22 and record the variable of interest. The data appear in the Process2 worksheet of the Quiz 2 Review Problems data workbook on Moodle. Collect data and calculate necessary statistics to test the hypothesis. Variance 20.89 d) Sketch the sampling distribution. Include the critical value and test statistic Critical Value: x =11.59 S'(n-1) _ 20.89(22–1) o? Test Statistic: Xố =10.97 40 e) Draw a conclusion and report that in the problem context. Reject Ho, conclude the process variance has decreased. f) Calculate the p-value for the hypothesis test Using table in book: 0.025 < p-value= P(xev <10.97) < 0.05 Using Excel: p-value=0.0366 A 52 44 51 58 48 51 53 47 43 49 50 54 52 47 47 49 38 49 50 42 55 52
3) Previous experience shows the variance of a given process to be 40. Process engineers are testing to determine whether this value has decreased. a) What is the appropriate null and alternate hypothesis to determine if the process variance has decreased? Ho:o² > 40 versus Ha:o² < 40 b) Choose a level of a. Use a = 0.05 for this problem. c) To test the hypothesis, the process engineers take a sample of 22 and record the variable of interest. The data appear in the Process2 worksheet of the Quiz 2 Review Problems data workbook on Moodle. Collect data and calculate necessary statistics to test the hypothesis. Variance 20.89 d) Sketch the sampling distribution. Include the critical value and test statistic Critical Value: x =11.59 S'(n-1) _ 20.89(22–1) o? Test Statistic: Xố =10.97 40 e) Draw a conclusion and report that in the problem context. Reject Ho, conclude the process variance has decreased. f) Calculate the p-value for the hypothesis test Using table in book: 0.025 < p-value= P(xev <10.97) < 0.05 Using Excel: p-value=0.0366 A 52 44 51 58 48 51 53 47 43 49 50 54 52 47 47 49 38 49 50 42 55 52

Holt Mcdougal Larson Pre-algebra: Student Edition 2012
1st Edition
ISBN:9780547587776
Author:HOLT MCDOUGAL
Publisher:HOLT MCDOUGAL
Chapter11: Data Analysis And Probability
Section: Chapter Questions
Problem 8CR

Related questions
Question
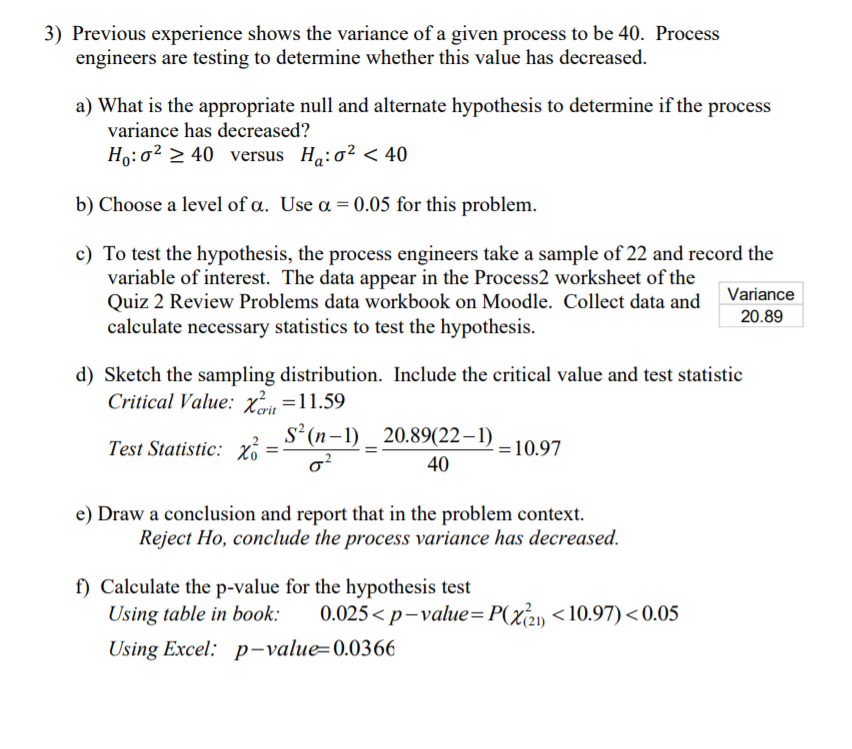
Transcribed Image Text:3) Previous experience shows the variance of a given process to be 40. Process
engineers are testing to determine whether this value has decreased.
a) What is the appropriate null and alternate hypothesis to determine if the process
variance has decreased?
Ho:o² > 40 versus Ha:o² < 40
b) Choose a level of a. Use a = 0.05 for this problem.
c) To test the hypothesis, the process engineers take a sample of 22 and record the
variable of interest. The data appear in the Process2 worksheet of the
Quiz 2 Review Problems data workbook on Moodle. Collect data and
calculate necessary statistics to test the hypothesis.
Variance
20.89
d) Sketch the sampling distribution. Include the critical value and test statistic
Critical Value: x =11.59
S'(n-1) _ 20.89(22–1)
o?
Test Statistic: Xố
=10.97
40
e) Draw a conclusion and report that in the problem context.
Reject Ho, conclude the process variance has decreased.
f) Calculate the p-value for the hypothesis test
Using table in book:
0.025 < p-value= P(xev <10.97) < 0.05
Using Excel: p-value=0.0366
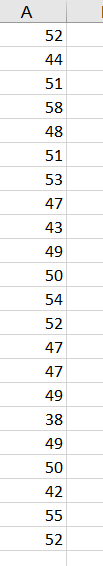
Transcribed Image Text:A
52
44
51
58
48
51
53
47
43
49
50
54
52
47
47
49
38
49
50
42
55
52
Expert Solution
This question has been solved!
Explore an expertly crafted, step-by-step solution for a thorough understanding of key concepts.

This is a popular solution!

Trending now
This is a popular solution!

Step by step
Solved in 3 steps with 3 images

Recommended textbooks for you
Holt Mcdougal Larson Pre-algebra: Student Edition…
Algebra
ISBN:
9780547587776
Author:
HOLT MCDOUGAL
Publisher:
HOLT MCDOUGAL
Holt Mcdougal Larson Pre-algebra: Student Edition…
Algebra
ISBN:
9780547587776
Author:
HOLT MCDOUGAL
Publisher:
HOLT MCDOUGAL