The weights of a sample of newborn calves are recorded in the table below: 43.0 Male weight (kg) Female weight (kg) 36.8 38.2 41.7 31.9 46.8 37.5 37.2 12.6 39.1 15.7 42.2 31.3 A hypothesis test at a 5% level of significance is conducted to see whether the mean weight of male calves, is the same as the mean weight ir of female calves. a State the null and alternative hypotheses. b Assuming the weights of both male and female calves are normally distributed with the same standard deviation, calculate the p-value for this test. c State, with a reason, whether the null hypothesis should be uccepted.
The weights of a sample of newborn calves are recorded in the table below: 43.0 Male weight (kg) Female weight (kg) 36.8 38.2 41.7 31.9 46.8 37.5 37.2 12.6 39.1 15.7 42.2 31.3 A hypothesis test at a 5% level of significance is conducted to see whether the mean weight of male calves, is the same as the mean weight ir of female calves. a State the null and alternative hypotheses. b Assuming the weights of both male and female calves are normally distributed with the same standard deviation, calculate the p-value for this test. c State, with a reason, whether the null hypothesis should be uccepted.

Glencoe Algebra 1, Student Edition, 9780079039897, 0079039898, 2018
18th Edition
ISBN:9780079039897
Author:Carter
Publisher:Carter
Chapter10: Statistics
Section10.4: Distributions Of Data
Problem 19PFA

Related questions
Question
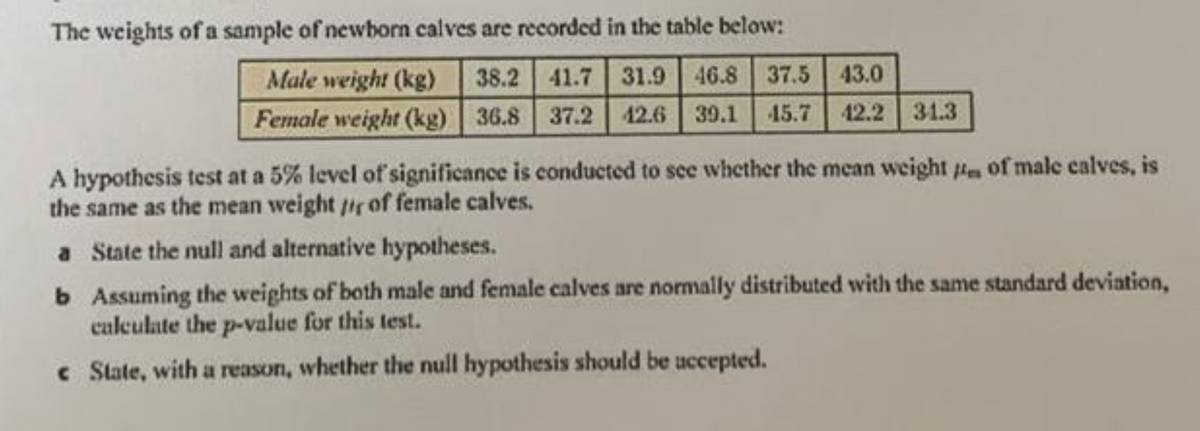
Transcribed Image Text:The weights of a sample of newborn calves are recorded in the table below:
Male weight (kg)
Female weight (kg) 36.8 37.2 12.6 39.1
38.2 41.7 31.9 46.8 37.5 43.0
45.7 42.2 31.3
A hypothesis test at a 5% level of significance is conducted to see whether the mean weight of male calves, is
the same as the mean weight ir of female calves.
a State the null and alternative hypotheses.
b Assuming the weights of both male and female calves are normally distributed with the same standard deviation,
calculate the p-value for this test.
c State, with a reason, whether the null hypothesis should be uccepted.
Expert Solution
This question has been solved!
Explore an expertly crafted, step-by-step solution for a thorough understanding of key concepts.

This is a popular solution!

Trending now
This is a popular solution!

Step by step
Solved in 2 steps with 2 images

Recommended textbooks for you
Glencoe Algebra 1, Student Edition, 9780079039897…
Algebra
ISBN:
9780079039897
Author:
Carter
Publisher:
McGraw Hill
Glencoe Algebra 1, Student Edition, 9780079039897…
Algebra
ISBN:
9780079039897
Author:
Carter
Publisher:
McGraw Hill