3) The file contains the overall miles per gallon (MPG) of 2010 family sedans: 24 21 22 23 24 34 34 34 20 20 22 22 44 32 20 20 22 20 39 20 Source: Data extracted from "Vehicle Ratings," Consumer Reports, April 2010, p. 29. a) Compute the mean, median, and mode. b) Compute the variance, standard deviation, and range. c) Are the data skewed? If so, how? 4) The file contains the cost (in cents) per 1-ounce serving for a sample of 13 chocolate chip
Q: ------ answer below and, if necessary, fill in the answer box within your choice. (Round to three…
A: The null and alternative hypotheses are: H0: ρ=0 H1: ρ≠0
Q: higher rate than owners of passenger cars. Use a 0.05 significance level to test that hypothesis. a.…
A: Given, Assume passenger cars as population 1 Sample size, n1 = 2127 Mean, x1 = 240 Assume commercial…
Q: In Washington, DC in 2020 the teen birth rate was 15.6. Calculate the value of the residual (be sure…
A: From the regression analysis output: The regression line is BirthRate^=-5.10+1.79 PovPct. The…
Q: There is sufficient evidence to warrant rejection of the claim that the first population proportion…
A:
Q: K A newspaper published an article about a study in which researchers subjected laboratory gloves to…
A: From the given technology results Test statistic (z) = 14.4964 Critical value z = 1.2816 P-value =…
Q: 2. Joe travels 280 miles on 12.3 gallons of gas. To the nearest tenth, what is the mileage rating…
A: Given: It is given that a car travels 280 miles on 12.3 gallons of gas.
Q: Suppose the age that children learn to walk is normally distributed with mean 13 months and standard…
A:
Q: tion. The following data represents the increase of Covid-19 cases in Washington State per day from…
A: Since you have posted a question with multiple subparts, we will solve first three subparts for you.…
Q: Two collaborators, Nicolas and Felipe, are talking about the order they received with the size of…
A: The number of pieces to be produced is equal to four. The average length of N's paper is around…
Q: TESTING HYPOTHESES FOR DIFFERENCES BETWEEN TWO MEANS OR PROPORTIONS 5.44 A consulting firm wants to…
A: Followings are the Explanation of the question Use the two-sample independent t test Given that,…
Q: Compute the standard error for the sample mean \bar xxˉ from a SRS of 16 observations with sample…
A:
Q: Using the artofstat.com website, click on Web Apps, Permutation Test.You should be on the tab at the…
A: The objective is to find the p-value for the Permutations test.
Q: Conditional probability distribution X given that Y = 1 f(x, y) 1/4 1/2 1/8 1/8 fxx (x) -1.0 -0.5…
A: x y f(x,y) -1 -2 1/4 -0.5 -1 1/2 0.5 1 1/8 1 2 1/8
Q: A repeated-measures ANOVA produces SSbetween treatments = 25 and MSbetween treatments = 5. In this…
A: Given,SSbetween treatments=25 MSbetween treatments = 5
Q: done on body temperatures of men and women. The results are shown in the table. Assume that the two…
A: Given μ μ1 μ2 n 11 59 x 97.54°F 97.46°F s 0.95°F 0.63°F
Q: Environmental Protection Agency standards require that the amount of lead in drinking water be less…
A: From the provided information, Sample size (n) = 12 The EPA standard require that the amount of lead…
Q: Consider Case Study 8.2 on page 238. Suppose 18 specimens were used for each type of paint in an…
A: The difference between the drying times of two paints = 1
Q: Describe what is meant by statistical significance.
A: Describe what is meant by statistical significance?
Q: Use the given data to find the equation of the regression line. Examine the scatterplot and identify…
A:
Q: ands and 436 do not. Use a 0.01 significance level to test the claim that the rate…
A: Given Here, we have to use two sample z test for difference between two population proportions. The…
Q: Let X have a binomial distribution with parameters n=25 and p. Calculate each of the following…
A: Given information: X follows the Binomial distribution n = 25 and p.
Q: A union of restaurant and foodservice workers would like to estimate the mean hourly wage, u, of…
A: given data claim : μ ≠ 8.08x¯ = 7.78s = 1.20 Accept Ho Reject Ho Ho is true correct…
Q: The standardized regression coefficient expresses the:
A: The standardized regression coefficient expresses the ?
Q: # 32
A: It is given that The equation which has the form E(y) = y^ = b0 + b1x1 + . . . + bpxp.
Q: 2) We conducted the previous study at night, right before a basketball game. We decided to also…
A: Given that: Sweatshirt Long Sleeved Shirt Short Sleeved Shirt Total Day-observed 13 14 9 36…
Q: 4. A 12-oz box of cereal costs $2.28, and a 22-oz box and state which one is the better deal. For…
A: Cost of 2oz box = 2.28 Cost per ounce = 2.28/12 = 0.19 dollars
Q: Which variable is the explanatory variable and which variable is the response variable? ? Explain…
A: Let X be the teen birth rate and Y be the people living in poverty.
Q: A community of rabbits begins with an initial population of 97 and grows 10% per month. Make a table…
A: Given The given data is as follows: Initial population is of 97 Growth rate, k=0.10
Q: On June 28, 2012 the U.S. Supreme Court upheld the much debated 2010 healthcare law, declaring it…
A: Given: n = 1012 P(Constitutional) = 0.46 P(Constitutional) = 1 - P(Constitutional) P(Constitutional)…
Q: Use the Table of Descriptive statistics, correlation (r), the standard error of the correlation…
A: From the computation r = 0.724224 zr=0.5ln1+r1-r=0.5 ln1.72420.2758=0.9164 SEzr =1n-3=112-3=0.33 The…
Q: If an analysis of variance is used for the following data, what would be the effect of changing the…
A:
Q: Suppose the mean IQ score of people in a certain country is 100. Suppose the director of a college…
A: Given information Population mean µ = 101 Sample size (n) = 39 Mean x̅ = 103.5 Standard deviation…
Q: population of values has a normal distribution with µ = 184.4 and σ = 75.7. a. Find the probability…
A: Answer:- Given, X ~ N(μ,σ ) (a) Where mean (μ )=184.4 , and a standard deviation σ =75.7…
Q: For a repeated-measures study comparing two treatment conditions, a researcher obtains a sample of n…
A: Given,n=10mean(MD)=6Variance(s2)=90
Q: K Listed in the data table are IQ scores for a random sample of subjects with medium lead levels in…
A: From the given information we conduct t test.
Q: Explain Bayes' theorem of conditional probability
A: Introduction The probability shows how likely an event will occur. Let BT denote the Bayes' theorem.
Q: Which of the following sets of data would produce the largest value for Cohen’s d if the difference…
A: Given that, the difference between the samples is 5 points.
Q: e claim that the type of crime is independent of whether the criminal was a stranger. ick here to…
A: Solution: Claim: The type of crime is independent of whether the criminal is a stranger.
Q: a) In a random sample of 20 second year statistics students from a normal distribution, N(μ, 0²)…
A: It is given that Sample size n = 20 ∑X = 30 , ∑X2 = 60 Note : Since you have asked multiple…
Q: A sample of 100 people is classified by gender (male/female) and by whether or not they are college…
A: Given that, A sample of 100 people is classified by gender and by whether or not college graduates.…
Q: You may need to use the appropriate technology to answer this question. The following is part of the…
A: Given information: Coefficients Standard error Constant -11.320 20.452 x1 0.788 0.302 x2…
Q: Test the claim that the mean GPA of night students is smaller than the mean GPA of day students at…
A: Given n1=n2=50 S1=0.07 S2=0.02
Q: a) Let X₁, X₂, X3,..., X, be a random sample of size n from population X. Suppose that X follows an…
A:
Q: The table below lists the frequency of wins for different post positions in a horse race. A post…
A: From the given data we conduct chi square test.
Q: 4. Birds' nests are always in danger from predators. If there are other nests close by, the chances…
A: Distance to nearest neighbor(d) Probability of predator (p) 20 47 40 34 60 32 80 17 100…
Q: ANOVA df Total SS Regression 2 121.0625 60.5312 50.1910 Residual 9 10.8542 1.2060 11 131.9167 MS…
A: Solution: Given information: n= 12 observation k= 1 independent variables
Q: You received a large batch of LEDs with dominant wavelength uniformly distributed between 622.5nm…
A: Given that a large batch of LEDs with dominant wavelength uniformly distributed between 622.5nm and…
Q: To test Ho: μ = 50 versus H₁ μ<50, a random sample of size n = 22 is obtained from a population that…
A: Hypotheses: H0:μ=50H1:μ<50
Q: (a) Suppose the sample of chickens from Supplier A contained 100 ppb of arsenic. Use the…
A: Since you have posted a question with multiple sub-parts, we will solve the first three sub-parts…
Q: a) Let Y be a random variable whose probability density function and cumulative distribution…
A: The level of significance is equal to probability of type I error. The power of test is rejecting H0…
only question 3 complete than rating helpful
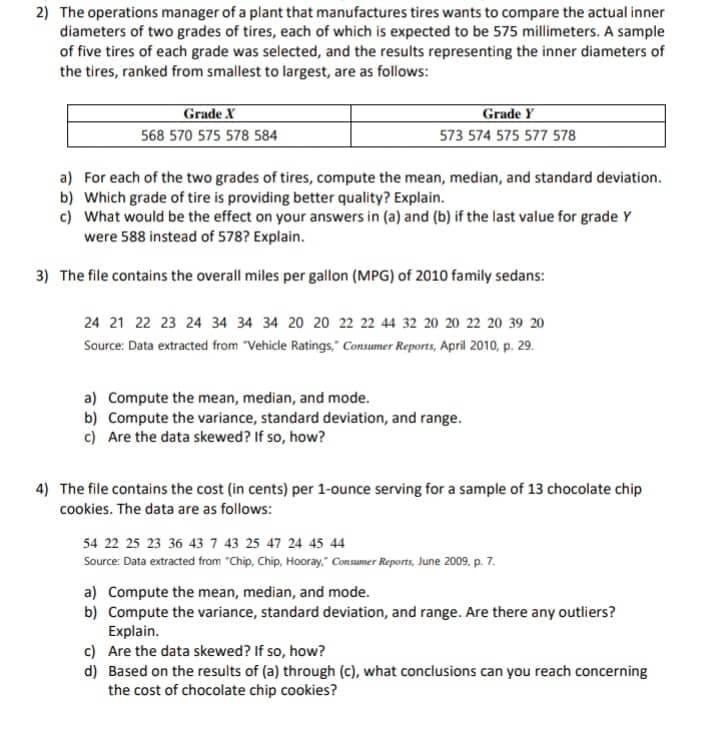
Step by step
Solved in 4 steps with 3 images
- Use theorem 5.4.2 to form a proportion in which SV is a geometric mean. Hint: SVTRVS Exercises 1-6The manager of a fleet of automobiles is testing two brands of radial tires. He assigns one tire of each brand at random to the two rear wheels of eight cars and runs the cars until the tires wear out. The data (in kilometers) are shown below: Car Brand 1 Brand 2 1 34900 36700 2 45500 47200 3 37100 37700 4 32000 31400 5 48900 47800 6 32800 36900 7 38500 38900 8 30100 31800 Find a 95% confidence interval on the difference in mean mileage. Assume that the differences of the distances are approximately normally distributed.for a sample of 9 automobiles, the mileage (in 1000s of miles) at which the original front brake pads were worn to 10% of their original thickness was measured, as was the mileage at which the original rear brake pads were worn to 10% of their original thickness. The results were as follows: Car Rear Front 1 41.2 32.2 2 36.3 27.2 3 45.8 34.7 4 46.6 37.3 5 39.6 30.7 6 52.3 40.5 7 51.7 41.0 8 46.3 33.8 9 47.4 36.8 a)Construct a 99.8% confidence interval for the difference in mean lifetime between the front and rear brake pads. Let d represent the mileage of the rear pads minus the mileage of the front ones. Round the answers to at least two decimal places. b)Because the confidence interval (contains/does not contain) values above 10 (in 1000s of miles), it (contradicts/does not contradict) the claim that the mean lifetime for rear brake pads is more than 10,000 miles more than the mean lifetime for front brake pads.
- calculate the number of hydrogen atoms in a 140.0g sample of tetraborane (B4H10)?The table below summarizes data from a survey of a sample of women. Using a 0.01significance level, and assuming that the sample sizes of 800 men and 300 women are predetermined, test the claim that the proportions of agree/disagree responses are the same for subjects interviewed by men and the subjects interviewed by women. Does it appear that the gender of the interviewer affected the responses of women? Gender of Interviewer Man Woman Women who agree 498 247 Women who disagree 302 53 Compute the test statistic, rounding to three decimal places. Find the critical value(s). (Round to three decimal places) What is the conclusion based on the hypothesis test?The number of contaminating particles on a silicon waferprior to a certain rinsing process was determined for eachwafer in a sample of size 100, resulting in the followingfrequencies:Number of particles 0 1 2 3 4 5 6 7Frequency 1 2 3 12 11 15 18 10Number of particles 8 9 10 11 12 13 14Frequency 12 4 5 3 1 2 1a. What proportion of the sampled wafers had at leastone particle? At least five particles?b. What proportion of the sampled wafers had betweenfive and ten particles, inclusive? Strictly between fiveand ten particles?c. Draw a histogram using relative frequency on thevertical axis. How would you describe the shape of thehistogram?
- Due to a manufacturing error,ten cans of regular soda were accidentally filled with diet soda and placed into a 36-pack. Suppose that two cans are randomly selected from the 36-pack. Complete parts (a) through (c).For a symmetric bell shaped data, of the five number summary are: 6,10, Y, 16 ,x thenThe racial/ethnic diversity of post high school students enrolled at MVCC during the fall 2020 semester is given below. Racial/Ethnic Diversity of Post High School Students Race/Ethnicity Percent* American Indian or Alaska Native 0.4% Asian 5.3% Black or African American 9.6% Hispanic or Latino 9.6% Two or more races 2.8% Native Hawaiian or Pacific Islander <0.1% Non-Resident Alien 0.5% Unknown 1.5% White 70.2% (*Percentages may not total 100 due to rounding) What is the race/ethnicity of the majority of students at MVCC? What total percent of students were either Black or African American or Hispanic or Latino? There were 3,444 students enrolled at MVCC at the time of the study. How many (not percent) students were Asian? (The answer must be a whole number.)
- An agent for a property management company would like to be able to predict the monthly rental cost for apartments based on the size of the apartment as defined by square footage. A sample of the rent of 25 apartments in a college rental neighborhood was selected, and the information collected revealed the following: Apartment Size (Sq. Ft.) Monthly Rent ($) 1 850 950 2 1,450 1,600 3 1,085 1,200 4 1,232 1,500 5 718 950 6 1,485 1,700 7 1,136 1,650 8 726 935 9 700 875 10 956 1,150 11 1,100 1,400 12 1,285 1,650 13 1,985 2,300 14 1,369 1,800 15 1,175 1,400 16 1,225 1,450 17 1,245 1,100 18 1,259 1,700 19 1,150 1,200 20 896 1,150 21 1,361 1,600 22 1,040 1,650 23 755 1,200 24 1,000 800 25 1,200 1,750 e) Determine the coefficient of determination r2 and then completely interpret…An agent for a property management company would like to be able to predict the monthly rental cost for apartments based on the size of the apartment as defined by square footage. A sample of the rent of 25 apartments in a college rental neighborhood was selected, and the information collected revealed the following: Apartment Size (Sq. Ft.) Monthly Rent ($) 1 850 950 2 1,450 1,600 3 1,085 1,200 4 1,232 1,500 5 718 950 6 1,485 1,700 7 1,136 1,650 8 726 935 9 700 875 10 956 1,150 11 1,100 1,400 12 1,285 1,650 13 1,985 2,300 14 1,369 1,800 15 1,175 1,400 16 1,225 1,450 17 1,245 1,100 18 1,259 1,700 19 1,150 1,200 20 896 1,150 21 1,361 1,600 22 1,040 1,650 23 755 1,200 24 1,000 800 25 1,200 1,750 i) Determine a 95% interval estimate for the average rent of apartments with 1000…The blood lead concentrations, in micrograms per deciliter (µg/dL), of 20 children from two different neighborhoods were measured. The results are recorded in the table. Neighborhood 1 3.97 3.92 3.99 3.71 4.13 3.97 4.02 3.88 4.12 3.70 3.96 3.78 4.30 4.09 4.13 4.94 3.93 3.95 3.86 3.83 Neighborhood 2 4.32 4.23 3.78 4.10 4.35 4.21 4.36 4.21 4.02 4.05 4.29 4.12 4.59 4.12 4.02 3.85 3.97 4.28 4.39 4.14 Using the same scale, draw a box-and-whisker plot for each of the two data sets, placing the second plot below the first. Considering that high blood lead concentrations are harmful to humans, in which of the two neighborhoods would you prefer to live? neighborhood1 or neighborhood 2