3) The following two sets of Excel output use are from the same data set as described above, but the first set of output is for the set of 35 CEO’s that earn the lowest total compensation and the second set of output is for a set of 40 CEO’s that earn the highest total compensation. a) What is heteroscedasticity? b) Why is heteroscedasticity a problem? c) Based on a comparison of the two sets of output, does it appear that there is heteroscedasticity in the data set? Explain.
3) The following two sets of Excel output use are from the same data set as described above, but the first set of output is for the set of 35 CEO’s that earn the lowest total compensation and the second set of output is for a set of 40 CEO’s that earn the highest total compensation. a) What is heteroscedasticity? b) Why is heteroscedasticity a problem? c) Based on a comparison of the two sets of output, does it appear that there is heteroscedasticity in the data set? Explain.

Glencoe Algebra 1, Student Edition, 9780079039897, 0079039898, 2018
18th Edition
ISBN:9780079039897
Author:Carter
Publisher:Carter
Chapter10: Statistics
Section10.6: Summarizing Categorical Data
Problem 27PPS

Related questions
Question
3) The following two sets of Excel output use are from the same data set as described above, but the first set of output is for the set of 35 CEO’s that earn the lowest total compensation and the second set of output is for a set of 40 CEO’s that earn the highest total compensation.
a) What is heteroscedasticity?
b) Why is heteroscedasticity a problem?
c) Based on a comparison of the two sets of output, does it appear that there is heteroscedasticity in the data set? Explain.
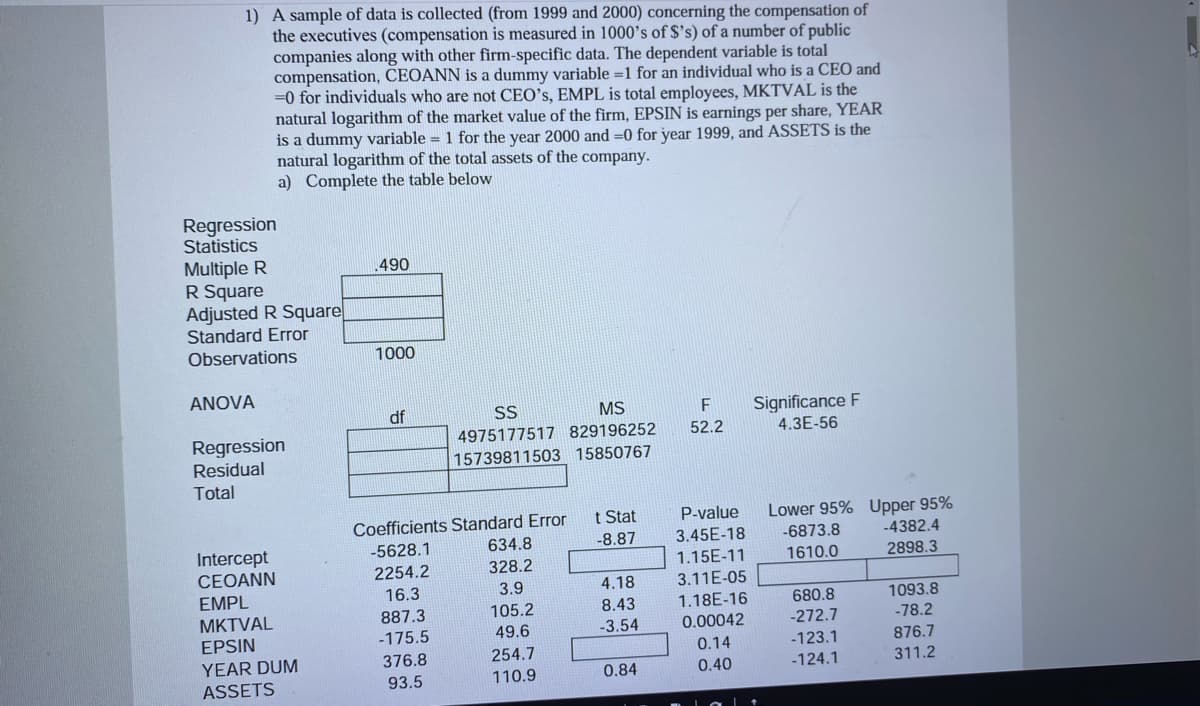
Transcribed Image Text:1) A sample of data is collected (from 1999 and 2000) concerning the compensation of
the executives (compensation is measured in 1000's of $'s) of a number of public
companies along with other firm-specific data. The dependent variable is total
compensation, CEOANN is a dummy variable =1 for an individual who is a CEO and
=0 for individuals who are not CEO's, EMPL is total employees, MKTVAL is the
natural logarithm of the market value of the firm, EPSIN is earnings per share, YEAR
is a dummy variable = 1 for the year 2000 and =0 for year 1999, and ASSETS is the
natural logarithm of the total assets of the company.
a) Complete the table below
Regression
Statistics
Multiple R
R Square
Adjusted R Square
Standard Error
Observations
490
1000
ANOVA
df
SS
MS
Significance F
4.3E-56
Regression
Residual
4975177517 829196252
52.2
15739811503 15850767
Total
Lower 95% Upper 95%
-4382.4
t Stat
P-value
Coefficients Standard Error
634.8
3.45E-18
1.15E-11
3.11E-05
1.18E-16
-5628.1
-8.87
-6873.8
Intercept
CEOANN
EMPL
МKTVAL
EPSIN
2254.2
328.2
1610.0
2898.3
16.3
3.9
4.18
680.8
1093.8
8.43
-3.54
887.3
105.2
49.6
0.00042
-272.7
-78.2
-175.5
0.14
-123.1
876.7
376.8
254.7
YEAR DUM
ASSETS
0.84
0.40
-124.1
311.2
93.5
110.9
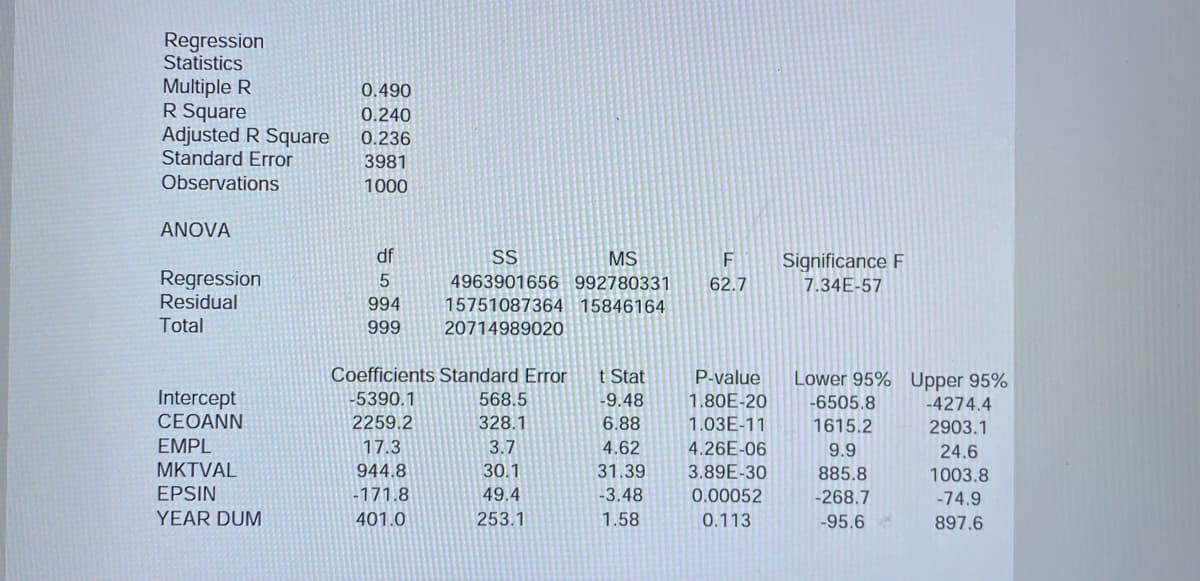
Transcribed Image Text:Regression
Statistics
Multiple R
R Square
Adjusted R Square
Standard Error
Observations
0.490
0.240
0.236
3981
1000
ANOVA
df
SS
MS
Significance F
Regression
Residual
4963901656 992780331
62.7
7.34E-57
994
15751087364 15846164
Total
999
20714989020
Coefficients Standard Error
t Stat
P-value
Lower 95% Upper 95%
Intercept
CEOANN
-5390.1
568.5
-9.48
1.80E-20
-6505.8
-4274.4
2259.2
328.1
6.88
1.03E-11
1615.2
2903.1
EMPL
17.3
3.7
4.62
4.26E-06
9.9
24.6
MKTVAL
944.8
30.1
31.39
3.89E-30
885.8
1003.8
EPSIN
-171.8
49.4
-3.48
0.00052
-268.7
-74.9
YEAR DUM
401.0
253.1
1.58
0.113
-95.6
897.6
Expert Solution
This question has been solved!
Explore an expertly crafted, step-by-step solution for a thorough understanding of key concepts.

Step by step
Solved in 4 steps

Recommended textbooks for you
Glencoe Algebra 1, Student Edition, 9780079039897…
Algebra
ISBN:
9780079039897
Author:
Carter
Publisher:
McGraw Hill

Linear Algebra: A Modern Introduction
Algebra
ISBN:
9781285463247
Author:
David Poole
Publisher:
Cengage Learning
Glencoe Algebra 1, Student Edition, 9780079039897…
Algebra
ISBN:
9780079039897
Author:
Carter
Publisher:
McGraw Hill
Linear Algebra: A Modern Introduction
Algebra
ISBN:
9781285463247
Author:
David Poole
Publisher:
Cengage Learning