3. A data set is normally distributed with a mean of 50 and a standard deviation of 8. What percent of data are (a) less than 60? (b) greater than 36? (c) greater than 56? (d) between 46 and 62?
3. A data set is normally distributed with a mean of 50 and a standard deviation of 8. What percent of data are (a) less than 60? (b) greater than 36? (c) greater than 56? (d) between 46 and 62?

Glencoe Algebra 1, Student Edition, 9780079039897, 0079039898, 2018
18th Edition
ISBN:9780079039897
Author:Carter
Publisher:Carter
Chapter10: Statistics
Section10.4: Distributions Of Data
Problem 19PFA

Related questions
Question
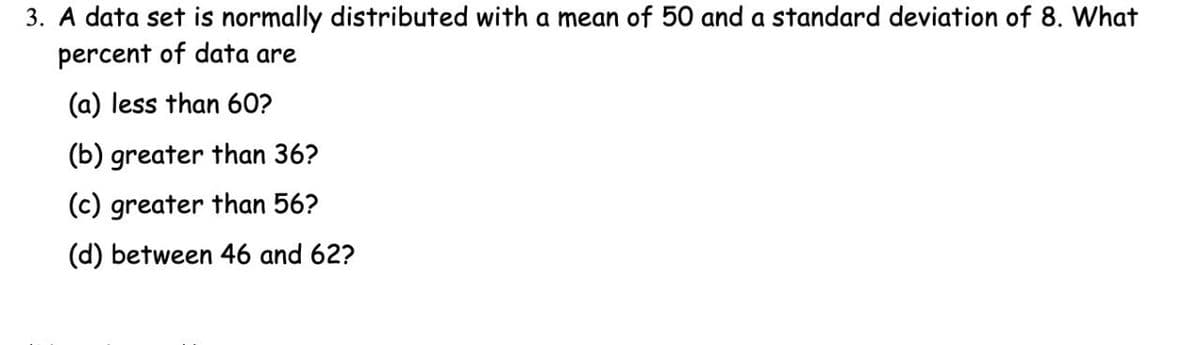
Transcribed Image Text:3. A data set is normally distributed with a mean of 50 and a standard deviation of 8. What
percent of data are
(a) less than 60?
(b) greater than 36?
(c) greater than 56?
(d) between 46 and 62?
Expert Solution
This question has been solved!
Explore an expertly crafted, step-by-step solution for a thorough understanding of key concepts.

This is a popular solution!

Trending now
This is a popular solution!

Step by step
Solved in 2 steps with 2 images

Recommended textbooks for you
Glencoe Algebra 1, Student Edition, 9780079039897…
Algebra
ISBN:
9780079039897
Author:
Carter
Publisher:
McGraw Hill
Glencoe Algebra 1, Student Edition, 9780079039897…
Algebra
ISBN:
9780079039897
Author:
Carter
Publisher:
McGraw Hill