The average American consumes 97 liters of alcohol per year. Does the average college student consume a different amount of alcohol per year? A researcher surveyed 12 randomly selected college students and found that they averaged 79.1 liters of alcohol consumed per year with a standard deviation of 19 liters. What can be concluded at the the a = 0.05 level of significance? a. For this study, we should use Select an answer b. The null and alternative hypotheses would be: Ho: ? Select an answer v H₁: ?v Select an answer ✓ c. The test statistic?v= (please show your answer to 3 decimal places.) (Please show your answer to 4 decimal places) d. The p-value =
The average American consumes 97 liters of alcohol per year. Does the average college student consume a different amount of alcohol per year? A researcher surveyed 12 randomly selected college students and found that they averaged 79.1 liters of alcohol consumed per year with a standard deviation of 19 liters. What can be concluded at the the a = 0.05 level of significance? a. For this study, we should use Select an answer b. The null and alternative hypotheses would be: Ho: ? Select an answer v H₁: ?v Select an answer ✓ c. The test statistic?v= (please show your answer to 3 decimal places.) (Please show your answer to 4 decimal places) d. The p-value =

MATLAB: An Introduction with Applications
6th Edition
ISBN:9781119256830
Author:Amos Gilat
Publisher:Amos Gilat
Chapter1: Starting With Matlab
Section: Chapter Questions
Problem 1P

Related questions
Question
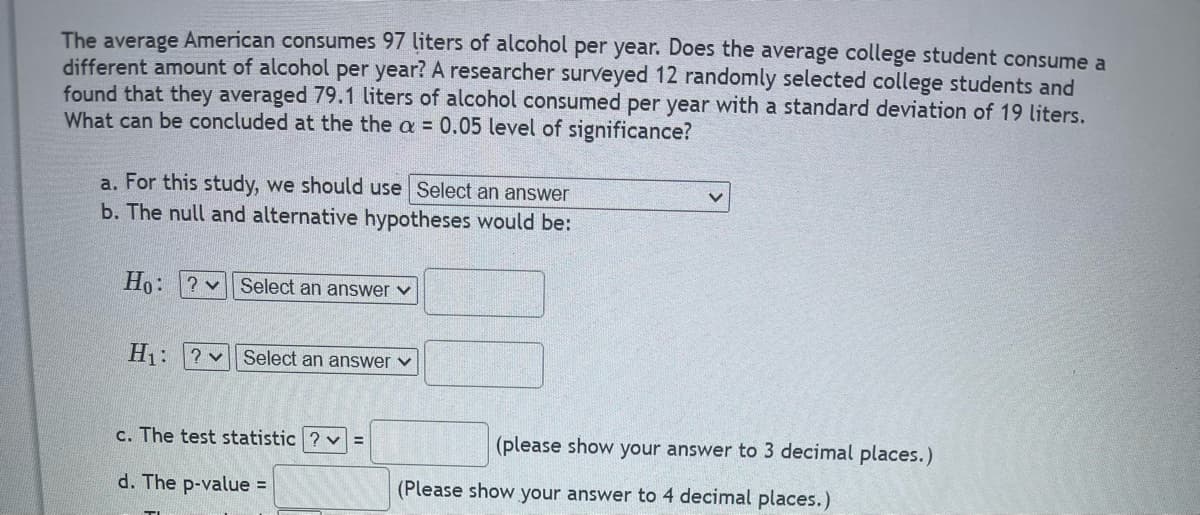
Transcribed Image Text:The average American consumes 97 liters of alcohol per year. Does the average college student consume a
different amount of alcohol per year? A researcher surveyed 12 randomly selected college students and
found that they averaged 79.1 liters of alcohol consumed per year with a standard deviation of 19 liters.
What can be concluded at the the a = 0.05 level of significance?
a. For this study, we should use Select an answer
b. The null and alternative hypotheses would be:
Ho: ? Select an answer
H₁: ? Select an answer ✓
c. The test statistic ? v =
(please show your answer to 3 decimal places.)
(Please show your answer to 4 decimal places.)
d. The p-value =
Expert Solution
This question has been solved!
Explore an expertly crafted, step-by-step solution for a thorough understanding of key concepts.

Step by step
Solved in 3 steps with 4 images

Recommended textbooks for you
MATLAB: An Introduction with Applications
Statistics
ISBN:
9781119256830
Author:
Amos Gilat
Publisher:
John Wiley & Sons Inc

Probability and Statistics for Engineering and th…
Statistics
ISBN:
9781305251809
Author:
Jay L. Devore
Publisher:
Cengage Learning

Statistics for The Behavioral Sciences (MindTap C…
Statistics
ISBN:
9781305504912
Author:
Frederick J Gravetter, Larry B. Wallnau
Publisher:
Cengage Learning
MATLAB: An Introduction with Applications
Statistics
ISBN:
9781119256830
Author:
Amos Gilat
Publisher:
John Wiley & Sons Inc
Probability and Statistics for Engineering and th…
Statistics
ISBN:
9781305251809
Author:
Jay L. Devore
Publisher:
Cengage Learning
Statistics for The Behavioral Sciences (MindTap C…
Statistics
ISBN:
9781305504912
Author:
Frederick J Gravetter, Larry B. Wallnau
Publisher:
Cengage Learning

Elementary Statistics: Picturing the World (7th E…
Statistics
ISBN:
9780134683416
Author:
Ron Larson, Betsy Farber
Publisher:
PEARSON

The Basic Practice of Statistics
Statistics
ISBN:
9781319042578
Author:
David S. Moore, William I. Notz, Michael A. Fligner
Publisher:
W. H. Freeman

Introduction to the Practice of Statistics
Statistics
ISBN:
9781319013387
Author:
David S. Moore, George P. McCabe, Bruce A. Craig
Publisher:
W. H. Freeman