3. A short study is conducted involving 5 tenured professors to investigate the relationship of professor's age and their blood pressure. What is the regression equation of it? Professor Age BP 1 35 112 2 40 128 38 130 4 44 138 5 67 158 3.
Q: . A wildlife researcher is interested in predicting an alligator’s weight (in pounds) based on its…
A:
Q: A research was conducted relating job satisfaction (measured as a score based on a rating scale from…
A: Given: The regression model Job satisfaction = 5.64 + 0.1107 Years on the Job.
Q: Assume that there is a positive linear correlation between the variable R (return rate in percent of…
A: The regression equation is R = 2.3t + 5.3, where t is the age in years of the investment and R…
Q: A researcher collected statistics on the sales amount of a product in 120 different markets and the…
A: a) Since Sales is dependent on advertising through TV, Newspaper and Radio, Hence, Sales should be…
Q: Find the correlation between age and blood pressure using simple and Spearman's correlation…
A: Use EXCEL to obtain the value correlation coefficient r: EXCEL procedure: Go to EXCEL Go to…
Q: Suppose you are estimating a wage regression, where salary is the dependent variable and age, years…
A: Given that, for estimating a wage regression, where salary is the dependent variable and age, years…
Q: The following data relate to marks obtained by 250 students in Example Accountancy and Statistics in…
A: Solution is given: Hope the answer is helpful.
Q: In a random sample of pediatric patients at a local hospital, the age of a patient and the patient's…
A: The value of r is 0.8.
Q: Is this statement true "In a nonlinear regression, the slope of the population regression function…
A: From the given information, Consider, non linear regression is as follows: Y =α +βx2 Now slope of…
Q: A researcher is interested in seeing the relationship between the number of hours slept and mood.…
A: Regression: The regression analysis is conducted here by using EXCEL. The software procedure is…
Q: Score GPA Hours Absences Gender 79 3.35 1.5 Female 73 2.75 3.5 Female 83 3.04 6.5 1 Male 73 2.53 3.0…
A: Hi, thanks for the question. Since there are multiple subparts posted in the question, we will…
Q: 1. Determine the number of wing flaps needed for 150,000 flying hours. 2. Is the regression model a…
A: Use the Excel and Perform the Regression. Followings are the Steps to perform the Regression 1) Open…
Q: The following table shows the mass of an object recorded over time. Time (min) Mass (g) 19 30 24…
A:
Q: What type of correlation exists between a person's age and the amount of sleep? O a. high positive O…
A: From the given data Select the correct choice
Q: Are the heights of the individuals affected by the heights of their parents ? 1. write the…
A: General form: y^=β0+β1x1+β2x2
Q: The owner of Showtime Movie Theaters, Inc., used multiple regression analysis to predict gross…
A: a. R2=SSRSST =32.734.9 =0.937 Adj R2=1-1-R2N-1N-p-1, N=sample size and p=number of variables…
Q: 1. Find the regression equation. 2. Make a forecast of the number of dropouts in SY 2013 - 2014. 3.…
A: When we want to predict the value of one variable, say y, from the given value of another variable,…
Q: Listed below are systolic blood pressure measurements (in mm Hg) obtained from the same woman.…
A: Find the regression equation, letting the right arm blood pressure be the predictor (x) variable.…
Q: A researcher is estimating the effect of studying on the test scores of student’s from a private…
A: Regression coefficient can be estimated to the private school indicator because class size is…
Q: 7. From the National Educators Survey (N= 450), we learn that the correlation between number of…
A: Since you have posted a question with multiple subparts, we will solve first three subparts for you.…
Q: 4. Is there a significant relationship between the father's weight and his newborn son's weight?…
A: Use the Excel and Perform the Regression. Followings are the Steps to perform the Regression 1) Open…
Q: Set up the regression equation and calculate the predicted satisfaction with major for someone with…
A:
Q: The following equation is the result of performing a multiple regression analysis: Job performance =…
A: According to the question, Job performance = 10 + (5*job knowledge) + (0.7*conscientiousness) where…
Q: Assume that there is a positive linear correlation between the variable R (return rate in percent of…
A: Correlation Coefficient: It is one of the statistical measures. It is used between any…
Q: The higher the difference between the observed value of y and the predicted value of y, the better…
A: The observed value of dependent variable is represented by y and the predicted value is represented…
Q: A car dealer wants to estimate the price of a used car based on the age of the car and the mileage.…
A: Solution: Given The estimated sample regression equation is Price^= 21510-1230Age - 0.035Miles
Q: Give an example of a problem dealing with two possibly related variables (Y and X) for which a…
A: The required example of a problem dealing with two possibly related variables (Y and X) for which a…
Q: Find the equation of the regression line for the given data. What would be the predicted number of…
A:
Q: Data was gathered from several homes for sale in Cincinnati Ohio, in order to examine the…
A: Given that When a regression equation is constructed in order to predict the price of a house based…
Q: with) how long a marriage will last from how long the divorcing couple's courtship was prior to…
A: The null and alternative hypothesis is given as follows: Ho: ß = 0 Ha: ß ╪ 0…
Q: When is the coefficient of certainty obtained from the regression equation equal to the square of…
A: Regression equation gives the relation between the response variable and the explanatory…
Q: Suppose that you are modelling cooling costs (y) as a function of the daily high temperature (x) for…
A: Correlation is the measure of the strength of association between two variables. The value of…
Q: 1. Develop a simple linear regression equation for starting salaries using an independent variable…
A: The simple linear regression equation is given by y^=β0+β1x+∈i let X be a independent variables Let…
Q: A car dealer wants to estimate the price of a used car based on the age of the car and the mileage.…
A: Solution: From the given information, the regression equation is Price = 21, 619 – 1022 Age – 0.03…
Q: The following table gives the yearly income (in thousands of dollars) of a large corporation for the…
A:
Q: 5. Find the regression equation for predicting weight from height for men age 18-24 in HANESS, based…
A: Let X represents height and Y represents weight. Then x̄= 70 , ȳ= 180 Sxx= 3 and Syy= 45…
Q: The Wall Street Journal asked Concur Technologies, Inc., an expense management company, to examine…
A: a) Given regression equation is Y=17.49+1.0334X.
Q: Suppose you wanted to test whether or not the payoff to an additional year of education was the same…
A: We want to test whether the pay-off for an additional year of education was same for mean and women…
Q: The U.S. Postal Service is attempting to reduce the number of complaints made by the public against…
A: Given: x is the hourly wage y is the number of complaints α=20.2β=-1.20
Q: If the estimated intercept of the regression equation is negative, we can say the estimated…
A: Let the regression equation is y= ax + b where y is dependent variable and x is independent…
Q: a. If the sample correlation coefficient between X and Y is positive, then the slope of the…
A: a. If the sample correlation coefficient between X and Y is positive, then the slope of the…
Q: Twenty members of an athletic club are studying the relationship between the time it takes an…
A: Identify the correct option for the 90% confidence interval for slope. The correct option is…
Q: The following data shows memory scores collected from adults of different ages. Age (X) Memory…
A:
Q: he following data describes weekly gross revenue ($1000s), television advertising expenditures…
A: a. Step-by-step procedure to find the regression equation using Excel: In Excel sheet, enter…
Q: 6- The objective of OLS regression is to find the best fitting model to describe the relationship…
A:
Q: Suppose you wanted to test whether or not the payoff to an additional year of education was the same…
A: We want to test whether the pay-off for an additional year of education was same for mean and women…
Q: A researcher found a linear correlation between course grades and the average number of hours spent…
A: Solution: The line of best fit is y^=3.7-0.786×x Where y = Course grades and x = average number of…
Q: The Wall Street Journal asked Concur Technologies, Inc., an expense management company, to examine…
A: Given Information: Sample size n=9 Equation of the regression line: y^=17.49+1.0334x
Q: A mathematics teacher wanted to see the correlation between test scores and homework. The homework…
A: All the calculation and the process of the problem is shown below please refer to the same.
Q: A fisheries biologist studying whitefish in a Canadian Lake collected data on the length (in…
A: Here given the results of linear regression . Constants = alpha = 25.55 Coefficient of calories =…
Please answer correctly and show the complete solutions, thank you.
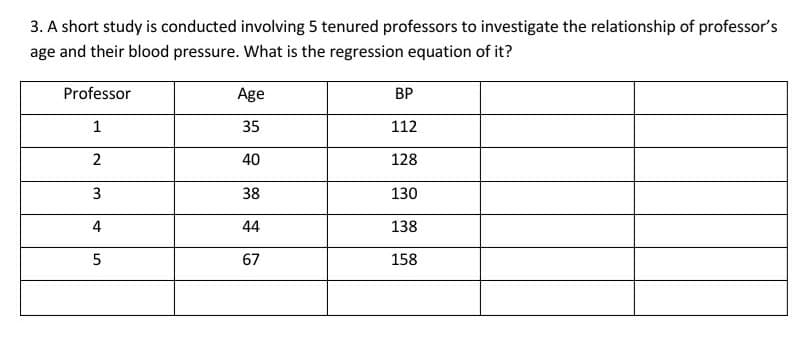
Step by step
Solved in 2 steps with 3 images
- Olympic Pole Vault The graph in Figure 7 indicates that in recent years the winning Olympic men’s pole vault height has fallen below the value predicted by the regression line in Example 2. This might have occurred because when the pole vault was a new event there was much room for improvement in vaulters’ performances, whereas now even the best training can produce only incremental advances. Let’s see whether concentrating on more recent results gives a better predictor of future records. (a) Use the data in Table 2 (page 176) to complete the table of winning pole vault heights shown in the margin. (Note that we are using x=0 to correspond to the year 1972, where this restricted data set begins.) (b) Find the regression line for the data in part ‚(a). (c) Plot the data and the regression line on the same axes. Does the regression line seem to provide a good model for the data? (d) What does the regression line predict as the winning pole vault height for the 2012 Olympics? Compare this predicted value to the actual 2012 winning height of 5.97 m, as described on page 177. Has this new regression line provided a better prediction than the line in Example 2?Suppose the regression in Equation is estimated using LoSTR andLoEL in place of HiSTR and HiEL, where LoSTR = 1 - HiSTR is anindicator for a low-class-size district and LoEL = 1 - HiEL is an indicatorfor a district with a low percentage of English learners. What are thevalues of the estimated regression coefficients?Suppose there is a significant correlation between variables. describe 2 cases under which it might be inappropriate to use the linear regression equation for prediction
- Suppose there is a significant correlation between variables. describe 2 instances in which it might be inappropriate to use the linear regression model for predictionCalculate the equation of the regression line and calculate the correlation coefficientThe following table gives the ages of female students in school and the corresponding Body Mass index (BMI) of 8 randomly selected students.(α=0.05) Age24223032211925 BMI27283029282726 Determine whether ages and BMI are significantly related.Determine the coefficient of linear determination and Intepret.Set up a linear regression equation to predict body mass index from age of students.Predict the body mass index of student who has the age of 26 years.
- how to plot the estimated regression line on the scatter diagram in letter c and how to solve for letter d with graphIn order to test for the significance of a regression model involving 3 independent variables and 47 observations, the numerator and denominator degrees of freedom (respectively) for the critical value of F areSuppose that a regional express delivery service company wants to estimate the cost of shipping a package (Y) as a function of cargo type, where cargo type includes the following possibilities: fragile, semi-fragile, and durable. Costs for 15 randomly chosen packages of approximately the same weight and same distance shipped, but of different cargo types, are provided in the file P14_16.xlsx. a. Estimate a regression equation using the given sample data, and interpret the estimated regression coefficients. b. According to the estimated regression equation, which cargo type is the most costly to ship? Which cargo type is the least costly to ship? c. How well does the estimated equation fit the given sample data? How might the fit be improved? d. Given the estimated regression equation, predict the cost of shipping a package with semi-fragile cargo.
- Suppose the entering freshmen at a certain college have a mean combined SAT score of 1231 with a standard deviation of 122 In the first semester, these students attained a mean GPA of 2.64, with a standard deviation of 0.53. A scatterplot showed the association to be reasonably linear, and the correlation between SAT score and GPA was 0.47 How do i find the regression line using the equationIf the coefficient of determination of a simple regression equation is 0.81, the correlation coefficient isFor the 2011 season, suppose the average number of passing yards per attempt for a certain NFL team was 6.1. Use the estimated regression equation developed in part (c) to predict the percentage of games won by that NFL team. (Note: For the 2011 season, suppose this NFL team's record was 7 wins and 9 losses. Round your answer to the nearest integer.)