The owner of Showtime Movie Theaters, Inc., used multiple regression analysis to predict gross revenue () as a function of television advertising (31) and newspaper advertising Weekly Gross Television Newspaper Revenue Advertising Advertising ($10005) ($1000s) ($1000s) 97 6.0 1.5 90 2.0 3.0 96 5.0 1.5 92 2.5 2.5 95 4.0 4.3
The owner of Showtime Movie Theaters, Inc., used multiple regression analysis to predict gross revenue () as a function of television advertising (31) and newspaper advertising Weekly Gross Television Newspaper Revenue Advertising Advertising ($10005) ($1000s) ($1000s) 97 6.0 1.5 90 2.0 3.0 96 5.0 1.5 92 2.5 2.5 95 4.0 4.3

Algebra & Trigonometry with Analytic Geometry
13th Edition
ISBN:9781133382119
Author:Swokowski
Publisher:Swokowski
Chapter3: Functions And Graphs
Section3.3: Lines
Problem 76E

Related questions
Question
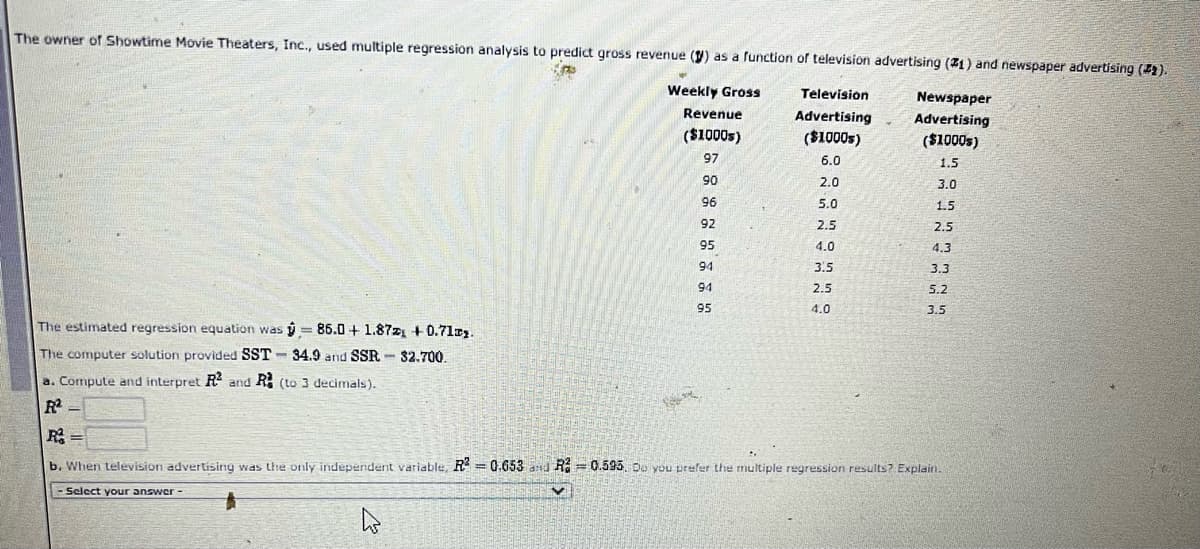
Transcribed Image Text:The owner of Showtime Movie Theaters, Inc., used multiple regression analysis to predict gross revenue (1) as a function of television advertising (Z1) and newspaper advertising ().
Weekly Gross
Television
Newspaper
Revenue
Advertising
Advertising
($1000s)
($1000s)
($1000s)
97
6.0
1.5
90
2.0
3.0
96
5.0
1.5
92
2.5
2.5
95
4.0
4.3
94
3.5
3.3
94
2.5
5.2
95
4.0
3.5
The estimated regression equation was y = 86.0 + 1.87z1 +0.71r2
The computer solution provided SST- 34.9 and SSR 32.700
a. Compute and interpret R and R: (to 3 decimals).
R
R
b. When television advertising was the only independent variable, R = 0.653 and Ra = 0.595, Do you prefer the multiple regression results? Explain.
Select your answer-
Expert Solution
This question has been solved!
Explore an expertly crafted, step-by-step solution for a thorough understanding of key concepts.

This is a popular solution!

Trending now
This is a popular solution!

Step by step
Solved in 2 steps

Recommended textbooks for you
Algebra & Trigonometry with Analytic Geometry
Algebra
ISBN:
9781133382119
Author:
Swokowski
Publisher:
Cengage

Glencoe Algebra 1, Student Edition, 9780079039897…
Algebra
ISBN:
9780079039897
Author:
Carter
Publisher:
McGraw Hill

Trigonometry (MindTap Course List)
Trigonometry
ISBN:
9781305652224
Author:
Charles P. McKeague, Mark D. Turner
Publisher:
Cengage Learning
Algebra & Trigonometry with Analytic Geometry
Algebra
ISBN:
9781133382119
Author:
Swokowski
Publisher:
Cengage
Glencoe Algebra 1, Student Edition, 9780079039897…
Algebra
ISBN:
9780079039897
Author:
Carter
Publisher:
McGraw Hill
Trigonometry (MindTap Course List)
Trigonometry
ISBN:
9781305652224
Author:
Charles P. McKeague, Mark D. Turner
Publisher:
Cengage Learning

Functions and Change: A Modeling Approach to Coll…
Algebra
ISBN:
9781337111348
Author:
Bruce Crauder, Benny Evans, Alan Noell
Publisher:
Cengage Learning

Big Ideas Math A Bridge To Success Algebra 1: Stu…
Algebra
ISBN:
9781680331141
Author:
HOUGHTON MIFFLIN HARCOURT
Publisher:
Houghton Mifflin Harcourt