3. As a student, you probably have noticed a curious phenomenon. In every class, there are some students who zip through exams and turn in their papers while everyone else is still on page 1. Other students cling to their exams and continue working until the very last minute. Have you ever wondered what grades these students get? Are the students who finish first the best in the class or are they simply conceding failure? To answer this question, we carefully observed a recent exam and recorded the amount of time each student spent working and the grade each student received. Is there a relationship between the two? a. Create a scatter plot of the data b. Calculate r and r2 c. Report results in APA style. d. What do results mean? Time Grade 44 94 60 76 40 89 57 92 52 81 45 88 M = 49.67 M = 86.67 SS = 313.33 SS 235.33 %3D %3D
3. As a student, you probably have noticed a curious phenomenon. In every class, there are some students who zip through exams and turn in their papers while everyone else is still on page 1. Other students cling to their exams and continue working until the very last minute. Have you ever wondered what grades these students get? Are the students who finish first the best in the class or are they simply conceding failure? To answer this question, we carefully observed a recent exam and recorded the amount of time each student spent working and the grade each student received. Is there a relationship between the two? a. Create a scatter plot of the data b. Calculate r and r2 c. Report results in APA style. d. What do results mean? Time Grade 44 94 60 76 40 89 57 92 52 81 45 88 M = 49.67 M = 86.67 SS = 313.33 SS 235.33 %3D %3D

Trigonometry (MindTap Course List)
8th Edition
ISBN:9781305652224
Author:Charles P. McKeague, Mark D. Turner
Publisher:Charles P. McKeague, Mark D. Turner
Chapter8: Complex Numbers And Polarcoordinates
Section: Chapter Questions
Problem 2RP: A Bitter Dispute With the publication of Ars Magna, a dispute intensified between Jerome Cardan and...

Related questions
Question
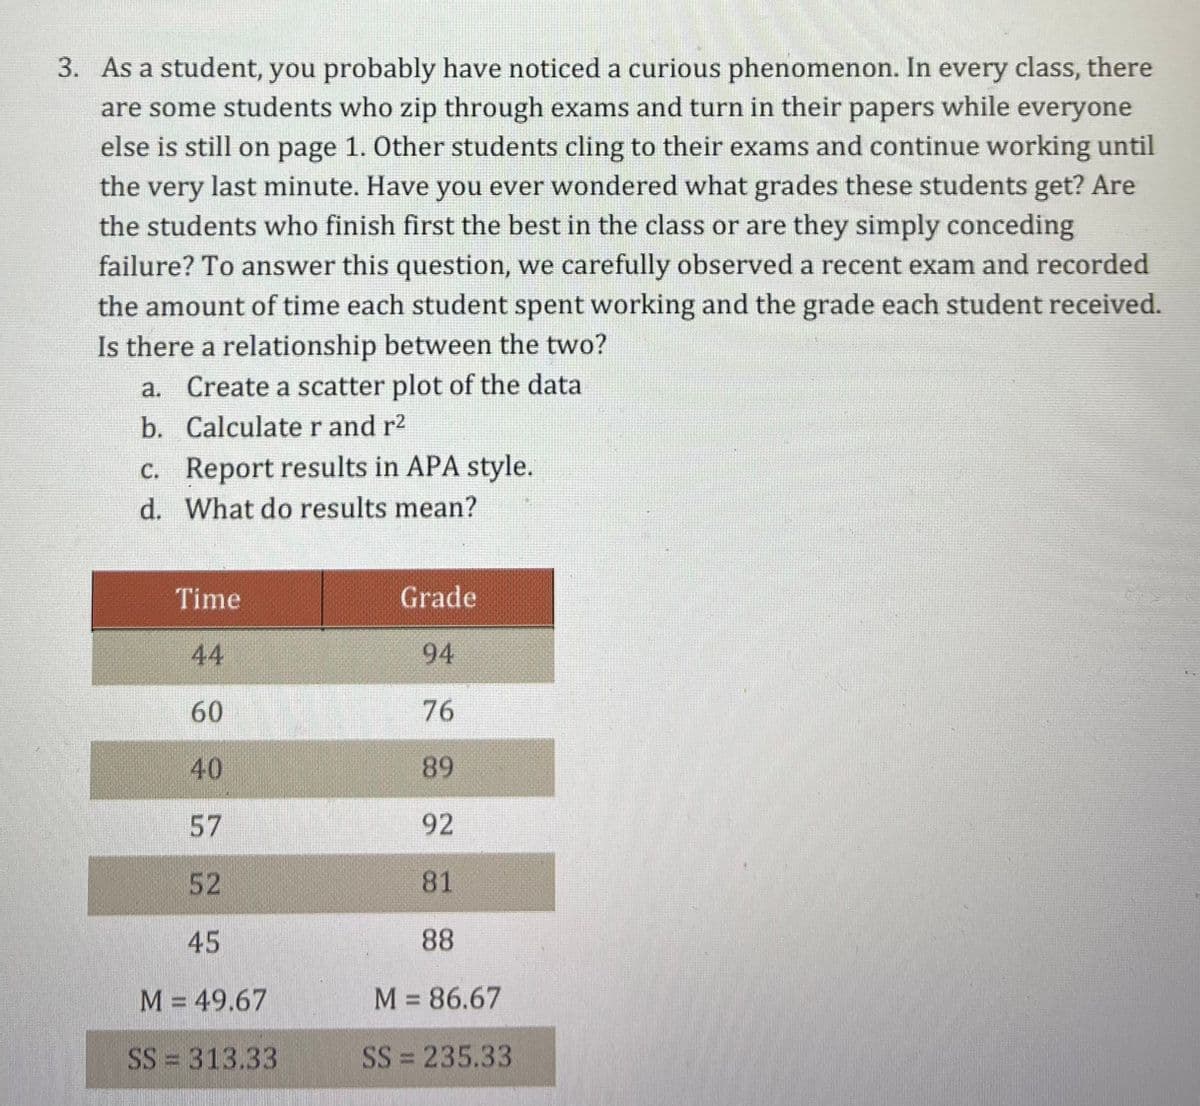
Transcribed Image Text:3. As a student, you probably have noticed a curious phenomenon. In every class, there
are some students who zip through exams and turn in their papers while everyone
else is still on page 1. Other students cling to their exams and continue working until
the very last minute. Have you ever wondered what grades these students get? Are
the students who finish first the best in the class or are they simply conceding
failure? To answer this question, we carefully observed a recent exam and recorded
the amount of time each student spent working and the grade each student received.
Is there a relationship between the two?
a. Create a scatter plot of the data
b. Calculater and r2
С.
c. Report results in APA style.
d. What do results mean?
Time
Grade
44
94
60
76
40
89
57
92
52
81
45
88
M = 49.67
M = 86.67
SS = 313.33
SS = 235.33
Expert Solution
This question has been solved!
Explore an expertly crafted, step-by-step solution for a thorough understanding of key concepts.

This is a popular solution!

Trending now
This is a popular solution!

Step by step
Solved in 2 steps with 2 images

Recommended textbooks for you
Trigonometry (MindTap Course List)
Trigonometry
ISBN:
9781305652224
Author:
Charles P. McKeague, Mark D. Turner
Publisher:
Cengage Learning
Trigonometry (MindTap Course List)
Trigonometry
ISBN:
9781305652224
Author:
Charles P. McKeague, Mark D. Turner
Publisher:
Cengage Learning