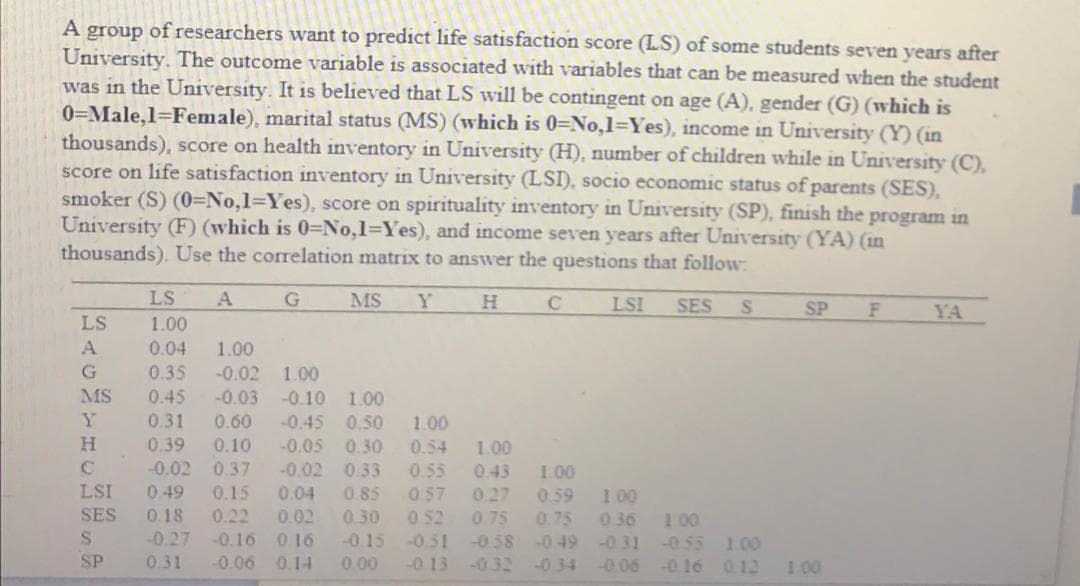
A group of researchers want to predict life satisfaction score (LS) of some students seven years after University. The outcome variable is associated with variables that can be measured when the student was in the University. It is believed that LS will be contingent on age (A), gender (G) (which is 0=Male,1=Female), marital status (MS) (which is 0=No,1=Yes), income in University (Y) (in thousands), score on health inventory in University (H), number of children while in University (C), score on life satisfaction inventory in University (LSI), socio economic status of parents (SES), smoker (S) (0=No,1=Yes), score on spirituality inventory in University (SP), finish the program in University (F) (which is 0=No,1=Yes), and income seven years after University (YA) (in thousands). Use the correlation matrix to answer the questions that follow:


Inverse Normal Distribution
The method used for finding the corresponding z-critical value in a normal distribution using the known probability is said to be an inverse normal distribution. The inverse normal distribution is a continuous probability distribution with a family of two parameters.
Mean, Median, Mode
It is a descriptive summary of a data set. It can be defined by using some of the measures. The central tendencies do not provide information regarding individual data from the dataset. However, they give a summary of the data set. The central tendency or measure of central tendency is a central or typical value for a probability distribution.
Z-Scores
A z-score is a unit of measurement used in statistics to describe the position of a raw score in terms of its distance from the mean, measured with reference to standard deviation from the mean. Z-scores are useful in statistics because they allow comparison between two scores that belong to different normal distributions.
1. Suppose that two students, A and B, are both 29 years old but A is a female whereas B is a male, A is single while B is married. Both had an income of 4500 cedis when in the university and both have health inventory score of 21. Student A had two kids while in the university whereas student B had 4 kids. Both scored 16 on life satisfaction inventories as well as 23 on socioeconomic status of parents. Student A was a smoker but B was not. A scored 7 while B scored 12 on spirituality inventory. Both finished the university program but whiles a was earning 9000 Ghana cedis seven years after university, B was earning 6800. What is the predicted difference in the life satisfaction score of these two student seven years after university?
2. How much higher is the life satisfaction score predicted to be if the score on spirituality inventory rises by 25?
3. Which one of the pairs of variables selected to be multicollinear may be deleted from the regression and why?
4. Interpret the coefficient of smoker (SYes) and income seven years after university f. Determine and explain the joint significance and the reliability of the regression model


Step by step
Solved in 2 steps with 3 images


