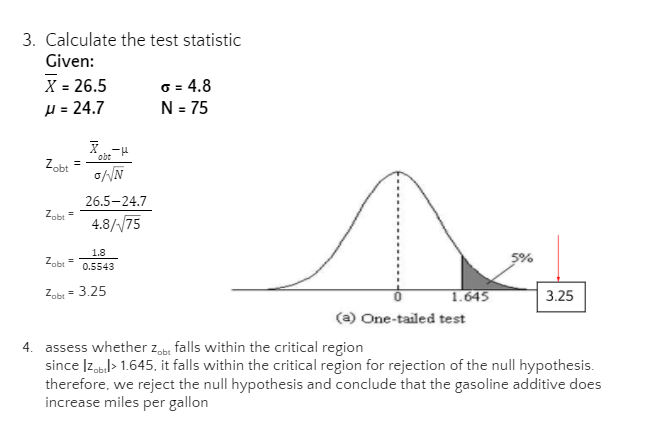
3. Calculate the test statistic Given: X = 26.5 H = 24.7 6 = 4.8 N = 75 Zobt 26.5–24.7 Zobt 4.8//75 1.8 Zob 5% 0.5543 Zob 3.25 1.645 | 3.25 (a) One-tailed test 4. assess whether zar falls within the critical region since Iz.> 1.645, it falls within the critical region for rejection of the null hypothesis. therefore, we reject the null hypothesis and conclude that the gasoline additive does increase miles per gallon
3. Calculate the test statistic Given: X = 26.5 H = 24.7 6 = 4.8 N = 75 Zobt 26.5–24.7 Zobt 4.8//75 1.8 Zob 5% 0.5543 Zob 3.25 1.645 | 3.25 (a) One-tailed test 4. assess whether zar falls within the critical region since Iz.> 1.645, it falls within the critical region for rejection of the null hypothesis. therefore, we reject the null hypothesis and conclude that the gasoline additive does increase miles per gallon

Glencoe Algebra 1, Student Edition, 9780079039897, 0079039898, 2018
18th Edition
ISBN:9780079039897
Author:Carter
Publisher:Carter
Chapter10: Statistics
Section10.3: Measures Of Spread
Problem 26PFA

Related questions
Question
Indicate the 4 steps.
Transcribed Image Text:3. Calculate the test statistic
Given:
X = 26.5
µ = 24.7
6 = 4.8
N = 75
1-
obt
Zobt
26.5-24.7
Zobt =
4.8//75
1.8
Zobt
5%
0.5543
Zabt =
3.25
1.645
3.25
(a) One-tailed test
4. assess whether z,b, falls within the critical region
since Iz.bl> 1.645, it falls within the critical region for rejection of the null hypothesis.
therefore, we reject the null hypothesis and conclude that the gasoline additive does
increase miles per gallon
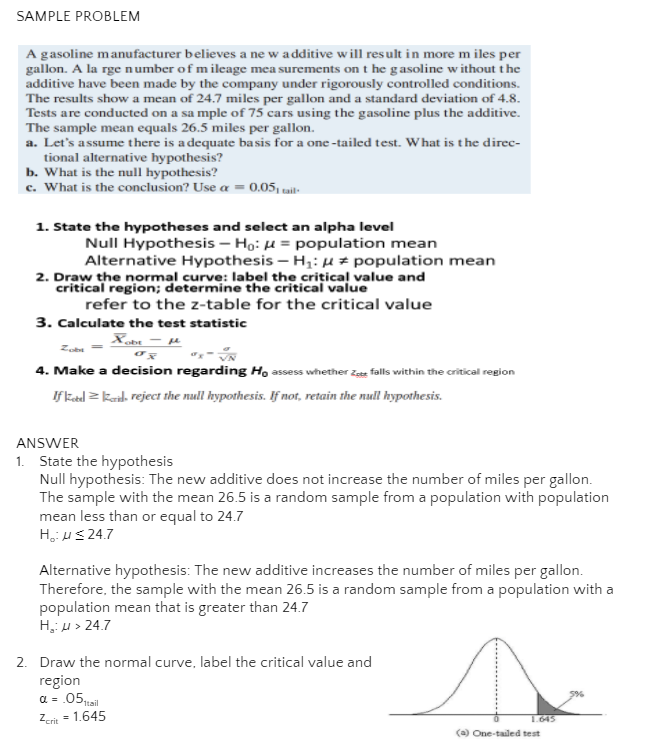
Transcribed Image Text:SAMPLE PROBLEM
A gasoline manufacturer believes a ne w additive will result in more m iles per
gallon. A la rge number of mileage mea surements on t he gasoline without the
additive have been made by the company under rigorously controlled conditions.
The results show a mean of 24.7 miles per gallon and a standard deviation of 4.8.
Tests are conducted on a sa mple of 75 cars using the gasoline plus the additive.
The sample mean equals 26.5 miles per gallon.
a. Let's assume there is a dequate ba sis for a one -tailed test. What is the direc-
tional alternative hypothesis?
b. What is the null hypothesis?
c. What is the conclusion? Use a = 0.05, cail-
1. State the hypotheses and select an alpha level
Null Hypothesis – Ho: µ = population mean
Alternative Hypothesis – H: µ # population mean
2. Draw the normal curve: label the critical value and
critical region; determine the critical value
refer to the z-table for the critical value
3. Calculate the test statistic
4. Make a decision regarding Ho assess whether Zee falls within the critical region
If kel z kail reject the null hypothesis. If not, retain the nul hypothesis.
ANSWER
1. State the hypothesis
Null hypothesis: The new additive does not increase the number of miles per gallon.
The sample with the mean 26.5 is a random sample from a population with population
mean less than or equal to 24.7
H us 24.7
Alternative hypothesis: The new additive increases the number of miles per gallon.
Therefore, the sample with the mean 26.5 is a random sample from a population with a
population mean that is greater than 24.7
H,: u > 24.7
2. Draw the normal curve, label the critical value and
region
a = .05sil
Zer = 1.645
5%
1.645
(a) One-tailed test
Expert Solution
This question has been solved!
Explore an expertly crafted, step-by-step solution for a thorough understanding of key concepts.

This is a popular solution!

Trending now
This is a popular solution!

Step by step
Solved in 2 steps with 2 images

Recommended textbooks for you
Glencoe Algebra 1, Student Edition, 9780079039897…
Algebra
ISBN:
9780079039897
Author:
Carter
Publisher:
McGraw Hill
Glencoe Algebra 1, Student Edition, 9780079039897…
Algebra
ISBN:
9780079039897
Author:
Carter
Publisher:
McGraw Hill