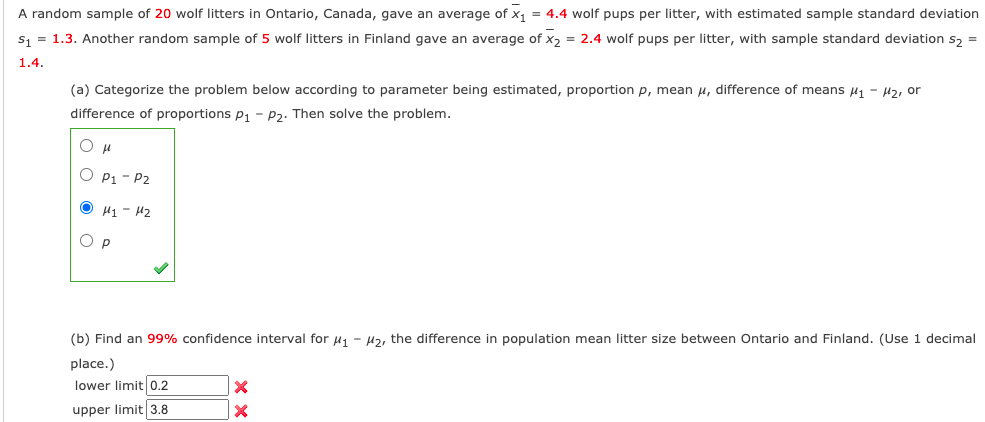
A random sample of 20 wolf litters in Ontario, Canada, gave an average of x, = 4.4 wolf pups per litter, with estimated sample standard deviation s = 1.3. Another random sample of 5 wolf litters in Finland gave an average of x, = 2.4 wolf pups per litter, with sample standard deviation s, = 1.4. (a) Categorize the problem below according to parameter being estimated, proportion p, mean u, difference of means u1 - Hz, or difference of proportions p, - P2. Then solve the problem. O P1 - P2 O 41- H2 O P (b) Find an 99% confidence interval for u, - H2, the difference in population mean litter size between Ontario and Finland. (Use 1 decimal place.) lower limit 0.2 upper limit 3.8


Unitary Method
The word “unitary” comes from the word “unit”, which means a single and complete entity. In this method, we find the value of a unit product from the given number of products, and then we solve for the other number of products.
Speed, Time, and Distance
Imagine you and 3 of your friends are planning to go to the playground at 6 in the evening. Your house is one mile away from the playground and one of your friends named Jim must start at 5 pm to reach the playground by walk. The other two friends are 3 miles away.
Profit and Loss
The amount earned or lost on the sale of one or more items is referred to as the profit or loss on that item.
Units and Measurements
Measurements and comparisons are the foundation of science and engineering. We, therefore, need rules that tell us how things are measured and compared. For these measurements and comparisons, we perform certain experiments, and we will need the experiments to set up the devices.
hi how do u solve this

Step by step
Solved in 4 steps with 2 images


