3. Consider a study in which 2205 adolescents age 12 to 19 took a cardiovascular treadmill test. The researchers conducting the study indicated that the sample was selected in such a way that it could be regarded as representative of adolescents nationwide. Of the 2205 adolescents tested, 750 showed a low level of cardiovascular fitness. a) Construct a 98% confidence interval for the proportion of adolescents age 12 to 19 who showed a low level of cardiovascular fitness. b) Does this sample provide support for the claim that more than 30% of adolescents have a low level of cardiovascular fitness? Use a 0.01 level of significance. Use the critical value approach. Use the p-value approach. i. ii.
3. Consider a study in which 2205 adolescents age 12 to 19 took a cardiovascular treadmill test. The researchers conducting the study indicated that the sample was selected in such a way that it could be regarded as representative of adolescents nationwide. Of the 2205 adolescents tested, 750 showed a low level of cardiovascular fitness. a) Construct a 98% confidence interval for the proportion of adolescents age 12 to 19 who showed a low level of cardiovascular fitness. b) Does this sample provide support for the claim that more than 30% of adolescents have a low level of cardiovascular fitness? Use a 0.01 level of significance. Use the critical value approach. Use the p-value approach. i. ii.

Glencoe Algebra 1, Student Edition, 9780079039897, 0079039898, 2018
18th Edition
ISBN:9780079039897
Author:Carter
Publisher:Carter
Chapter4: Equations Of Linear Functions
Section: Chapter Questions
Problem 8SGR

Related questions
Question
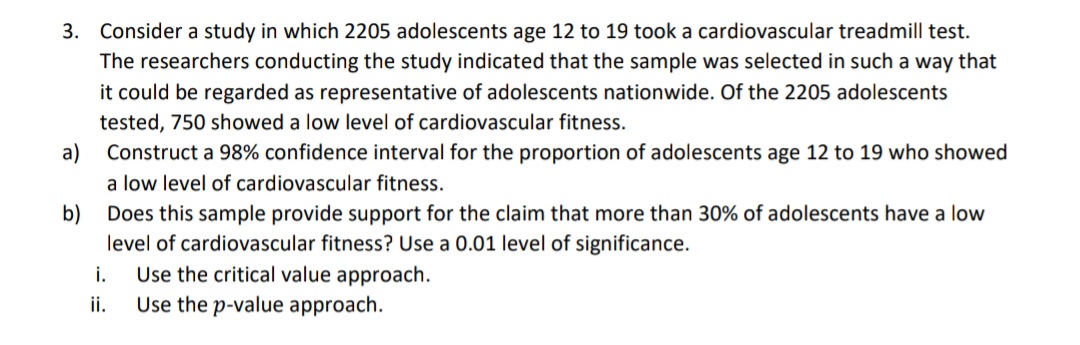
Transcribed Image Text:3. Consider a study in which 2205 adolescents age 12 to 19 took a cardiovascular treadmill test.
The researchers conducting the study indicated that the sample was selected in such a way that
it could be regarded as representative of adolescents nationwide. Of the 2205 adolescents
tested, 750 showed a low level of cardiovascular fitness.
a)
Construct a 98% confidence interval for the proportion of adolescents age 12 to 19 who showed
a low level of cardiovascular fitness.
b) Does this sample provide support for the claim that more than 30% of adolescents have a low
level of cardiovascular fitness? Use a 0.01 level of significance.
i.
ii.
Use the critical value approach.
Use the p-value approach.
Expert Solution
This question has been solved!
Explore an expertly crafted, step-by-step solution for a thorough understanding of key concepts.

Step by step
Solved in 3 steps with 3 images

Recommended textbooks for you
Glencoe Algebra 1, Student Edition, 9780079039897…
Algebra
ISBN:
9780079039897
Author:
Carter
Publisher:
McGraw Hill

College Algebra (MindTap Course List)
Algebra
ISBN:
9781305652231
Author:
R. David Gustafson, Jeff Hughes
Publisher:
Cengage Learning
Glencoe Algebra 1, Student Edition, 9780079039897…
Algebra
ISBN:
9780079039897
Author:
Carter
Publisher:
McGraw Hill
College Algebra (MindTap Course List)
Algebra
ISBN:
9781305652231
Author:
R. David Gustafson, Jeff Hughes
Publisher:
Cengage Learning