3. Consumer surplus for a group of consumers The following graph shows the demand curve for a group of consumers in the U.S. market (blue line) for laptops. The market price of a laptop is shown by the black horizontal line at $150. Each rectangle you can place on the following graph corresponds to a particular buyer in this market: orange (square symbols) for Edison, green (triangie symbols) for Hilary, purple (diamond symbols) for Kevin, tan (dash symbols) for Maria, and blue (circle symbols) for Rajiv. Use the rectangles to shade the areas representing consumer surplus for each person who is willing and able to purchase a laptop at a market price of $150. (Note: If a person will not purchase a laptop at the market price, indicate this by leaving his or her rectangle in its original position on the palette.) 400 Ed san Edison Hlary 300 250 Hilary Kain 200 Market Price Kevin 150 Mara 100 Maria 50 Rajv Rajv QUANTITY (Lastopa) Based on the information on the previous graph, you can tell that at the given market price, and total consumer surplus in this mart will buy laptops one consumer two conslimers PRICE (Dolars per laptop) two consumers Suppose the market price of a laptop increases to $250. three consumers On the following graph, use the rectangles once again to shade th four consumers g consumer surplus for each person who is willing and able to purchase a lapte orange (square symbols) for Edison, green (triangle symbols) for for Kevin, tan (dash symbols) for Maria, and blue (circle symbols) for Rajiv. (Note: If a person will not purchase a laptop at the new market price, indicate this by leaving his or her rectangle in its original position on the palette.) tet price: nond symbols) five consumers 400 Edson జద Edson Hlary 200 Markat Price 250 Hilary Kavin 200 Kevin 150 Mara 100 Maria Rajv Rajv QUANTITY (Lastope) Based on the information in the second graph, when the market price of a laptop increases to $250, the number of consumers willing to buy a laptop consumer surplus to and total to
3. Consumer surplus for a group of consumers The following graph shows the demand curve for a group of consumers in the U.S. market (blue line) for laptops. The market price of a laptop is shown by the black horizontal line at $150. Each rectangle you can place on the following graph corresponds to a particular buyer in this market: orange (square symbols) for Edison, green (triangie symbols) for Hilary, purple (diamond symbols) for Kevin, tan (dash symbols) for Maria, and blue (circle symbols) for Rajiv. Use the rectangles to shade the areas representing consumer surplus for each person who is willing and able to purchase a laptop at a market price of $150. (Note: If a person will not purchase a laptop at the market price, indicate this by leaving his or her rectangle in its original position on the palette.) 400 Ed san Edison Hlary 300 250 Hilary Kain 200 Market Price Kevin 150 Mara 100 Maria 50 Rajv Rajv QUANTITY (Lastopa) Based on the information on the previous graph, you can tell that at the given market price, and total consumer surplus in this mart will buy laptops one consumer two conslimers PRICE (Dolars per laptop) two consumers Suppose the market price of a laptop increases to $250. three consumers On the following graph, use the rectangles once again to shade th four consumers g consumer surplus for each person who is willing and able to purchase a lapte orange (square symbols) for Edison, green (triangle symbols) for for Kevin, tan (dash symbols) for Maria, and blue (circle symbols) for Rajiv. (Note: If a person will not purchase a laptop at the new market price, indicate this by leaving his or her rectangle in its original position on the palette.) tet price: nond symbols) five consumers 400 Edson జద Edson Hlary 200 Markat Price 250 Hilary Kavin 200 Kevin 150 Mara 100 Maria Rajv Rajv QUANTITY (Lastope) Based on the information in the second graph, when the market price of a laptop increases to $250, the number of consumers willing to buy a laptop consumer surplus to and total to

Chapter6: Consumer Choice And Demand
Section: Chapter Questions
Problem 3.7P

Related questions
Question
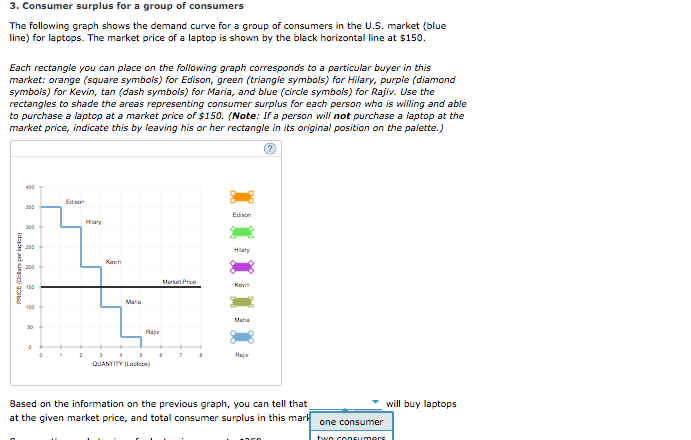
Transcribed Image Text:3. Consumer surplus for a group of consumers
The following graph shows the demand curve for a group of consumers in the U.S. market (blue
line) for laptops. The market price of a laptop is shown by the black horizontal line at $150.
Each rectangle you can place on the following graph corresponds to a particular buyer in this
market: orange (square symbols) for Edison, green (triangie symbols) for Hilary, purple (diamond
symbols) for Kevin, tan (dash symbols) for Maria, and blue (circle symbols) for Rajiv. Use the
rectangles to shade the areas representing consumer surplus for each person who is willing and able
to purchase a laptop at a market price of $150. (Note: If a person will not purchase a laptop at the
market price, indicate this by leaving his or her rectangle in its original position on the palette.)
400
Ed san
Edison
Hlary
300
250
Hilary
Kain
200
Market Price
Kevin
150
Mara
100
Maria
50
Rajv
Rajv
QUANTITY (Lastopa)
Based on the information on the previous graph, you can tell that
at the given market price, and total consumer surplus in this mart
will buy laptops
one consumer
two conslimers
PRICE (Dolars per laptop)
Transcribed Image Text:two consumers
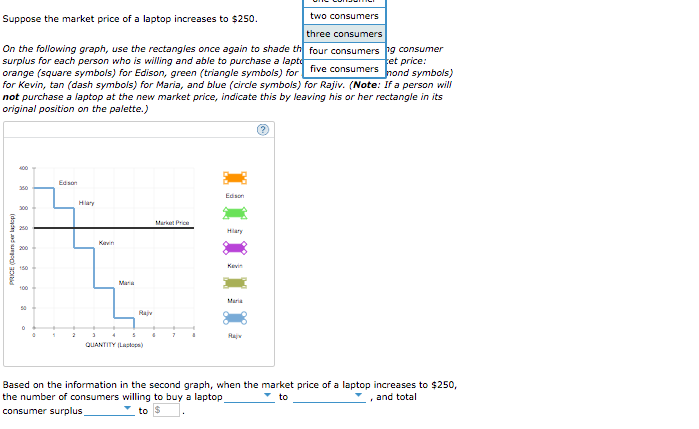
Suppose the market price of a laptop increases to $250.
three consumers
On the following graph, use the rectangles once again to shade th four consumers g consumer
surplus for each person who is willing and able to purchase a lapte
orange (square symbols) for Edison, green (triangle symbols) for
for Kevin, tan (dash symbols) for Maria, and blue (circle symbols) for Rajiv. (Note: If a person will
not purchase a laptop at the new market price, indicate this by leaving his or her rectangle in its
original position on the palette.)
tet price:
nond symbols)
five consumers
400
Edson
జద
Edson
Hlary
200
Markat Price
250
Hilary
Kavin
200
Kevin
150
Mara
100
Maria
Rajv
Rajv
QUANTITY (Lastope)
Based on the information in the second graph, when the market price of a laptop increases to $250,
the number of consumers willing to buy a laptop
consumer surplus
to
and total
to
Expert Solution
This question has been solved!
Explore an expertly crafted, step-by-step solution for a thorough understanding of key concepts.

This is a popular solution!

Trending now
This is a popular solution!

Step by step
Solved in 2 steps with 4 images

Recommended textbooks for you

Principles of Macroeconomics (MindTap Course List)
Economics
ISBN:
9781305971509
Author:
N. Gregory Mankiw
Publisher:
Cengage Learning

Essentials of Economics (MindTap Course List)
Economics
ISBN:
9781337091992
Author:
N. Gregory Mankiw
Publisher:
Cengage Learning
Principles of Macroeconomics (MindTap Course List)
Economics
ISBN:
9781305971509
Author:
N. Gregory Mankiw
Publisher:
Cengage Learning
Essentials of Economics (MindTap Course List)
Economics
ISBN:
9781337091992
Author:
N. Gregory Mankiw
Publisher:
Cengage Learning

Brief Principles of Macroeconomics (MindTap Cours…
Economics
ISBN:
9781337091985
Author:
N. Gregory Mankiw
Publisher:
Cengage Learning
