3. Draw linear graph from data: 2001 10230.3 2002 12782.6 2003 14322.2 Year = Export := 2004 13987.9 2005 18911.3 2006 21650.6
3. Draw linear graph from data: 2001 10230.3 2002 12782.6 2003 14322.2 Year = Export := 2004 13987.9 2005 18911.3 2006 21650.6

Algebra & Trigonometry with Analytic Geometry
13th Edition
ISBN:9781133382119
Author:Swokowski
Publisher:Swokowski
Chapter3: Functions And Graphs
Section3.5: Graphs Of Functions
Problem 57E

Related questions
Question
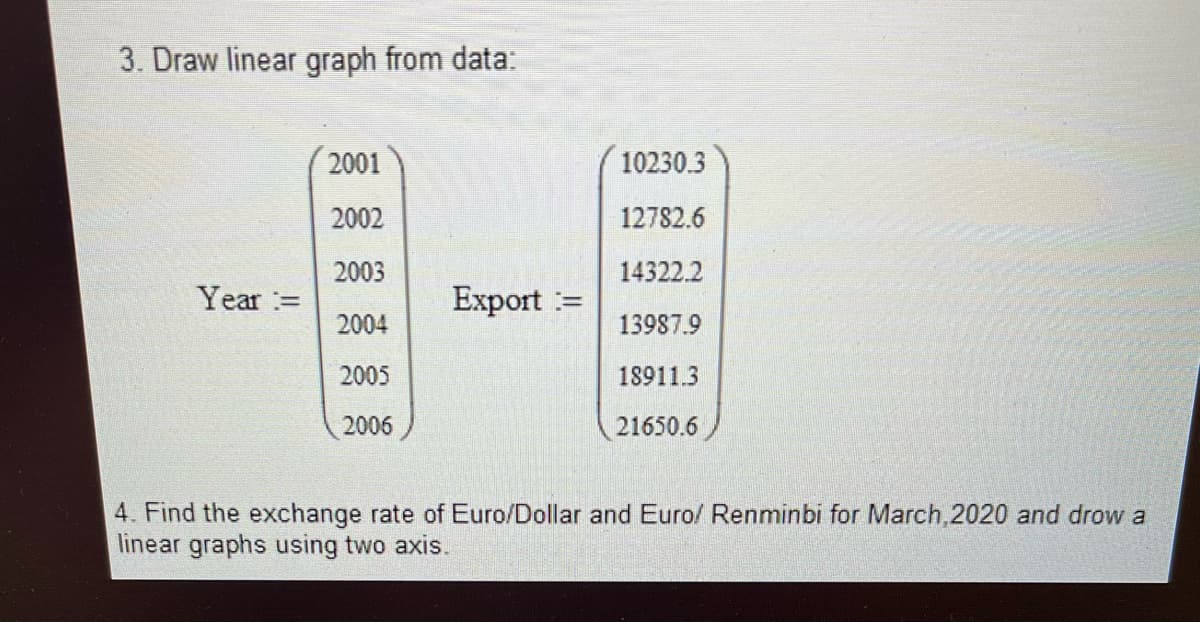
Transcribed Image Text:3. Draw linear graph from data:
2001
10230.3
2002
12782.6
2003
14322.2
Year =
Export :=
2004
13987.9
2005
18911.3
2006
21650.6
4. Find the exchange rate of Euro/Dollar and Euro/ Renminbi for March,2020 and drow a
linear graphs using two axis.
Expert Solution
This question has been solved!
Explore an expertly crafted, step-by-step solution for a thorough understanding of key concepts.

Step by step
Solved in 2 steps with 1 images

Recommended textbooks for you
Algebra & Trigonometry with Analytic Geometry
Algebra
ISBN:
9781133382119
Author:
Swokowski
Publisher:
Cengage

Algebra: Structure And Method, Book 1
Algebra
ISBN:
9780395977224
Author:
Richard G. Brown, Mary P. Dolciani, Robert H. Sorgenfrey, William L. Cole
Publisher:
McDougal Littell

Elementary Geometry For College Students, 7e
Geometry
ISBN:
9781337614085
Author:
Alexander, Daniel C.; Koeberlein, Geralyn M.
Publisher:
Cengage,
Algebra & Trigonometry with Analytic Geometry
Algebra
ISBN:
9781133382119
Author:
Swokowski
Publisher:
Cengage
Algebra: Structure And Method, Book 1
Algebra
ISBN:
9780395977224
Author:
Richard G. Brown, Mary P. Dolciani, Robert H. Sorgenfrey, William L. Cole
Publisher:
McDougal Littell
Elementary Geometry For College Students, 7e
Geometry
ISBN:
9781337614085
Author:
Alexander, Daniel C.; Koeberlein, Geralyn M.
Publisher:
Cengage,