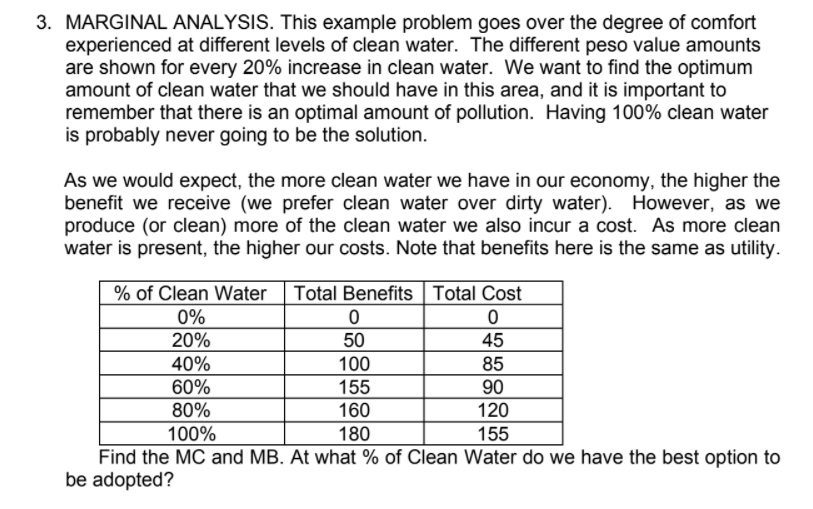
3. MARGINAL ANALYSIS. This example problem goes over the degree of comfort experienced at different levels of clean water. The different peso value amounts are shown for every 20% increase in clean water. We want to find the optimum amount of clean water that we should have in this area, and it is important to remember that there is an optimal amount of pollution. Having 100% clean water is probably never going to be the solution. As we would expect, the more clean water we have in our economy, the higher the benefit we receive (we prefer clean water over dirty water). However, as we produce (or clean) more of the clean water we also incur a cost. As more clean water is present, the higher our costs. Note that benefits here is the same as utility. Total Benefits Total Cost % of Clean Water 0% 20% 50 45 85 40% 100 60% 80% 90 155 160 120 100% 180 155 Find the MC and MB. At what % of Clean Water do we have the best option to be adopted?
3. MARGINAL ANALYSIS. This example problem goes over the degree of comfort experienced at different levels of clean water. The different peso value amounts are shown for every 20% increase in clean water. We want to find the optimum amount of clean water that we should have in this area, and it is important to remember that there is an optimal amount of pollution. Having 100% clean water is probably never going to be the solution. As we would expect, the more clean water we have in our economy, the higher the benefit we receive (we prefer clean water over dirty water). However, as we produce (or clean) more of the clean water we also incur a cost. As more clean water is present, the higher our costs. Note that benefits here is the same as utility. Total Benefits Total Cost % of Clean Water 0% 20% 50 45 85 40% 100 60% 80% 90 155 160 120 100% 180 155 Find the MC and MB. At what % of Clean Water do we have the best option to be adopted?
Principles of Economics 2e
2nd Edition
ISBN:9781947172364
Author:Steven A. Greenlaw; David Shapiro
Publisher:Steven A. Greenlaw; David Shapiro
Chapter12: Environmental Protection And Negative Externalities
Section: Chapter Questions
Problem 5SCQ: Consider two approaches to reducing emissions of CO2 into the environment from manufacturing...
Related questions
Question

Transcribed Image Text:3. MARGINAL ANALYSIS. This example problem goes over the degree of comfort
experienced at different levels of clean water. The different peso value amounts
are shown for every 20% increase in clean water. We want to find the optimum
amount of clean water that we should have in this area, and it is important to
remember that there is an optimal amount of pollution. Having 100% clean water
is probably never going to be the solution.
As we would expect, the more clean water we have in our economy, the higher the
benefit we receive (we prefer clean water over dirty water). However, as we
produce (or clean) more of the clean water we also incur a cost. As more clean
water is present, the higher our costs. Note that benefits here is the same as utility.
% of Clean Water
Total Benefits Total Cost
0%
20%
50
45
40%
100
155
85
60%
90
80%
160
120
100%
180
155
Find the MC and MB. At what % of Clean Water do we have the best option to
be adopted?
Expert Solution
This question has been solved!
Explore an expertly crafted, step-by-step solution for a thorough understanding of key concepts.
Step by step
Solved in 2 steps

Knowledge Booster
Learn more about
Need a deep-dive on the concept behind this application? Look no further. Learn more about this topic, economics and related others by exploring similar questions and additional content below.Recommended textbooks for you

Principles of Economics 2e
Economics
ISBN:
9781947172364
Author:
Steven A. Greenlaw; David Shapiro
Publisher:
OpenStax

Essentials of Economics (MindTap Course List)
Economics
ISBN:
9781337091992
Author:
N. Gregory Mankiw
Publisher:
Cengage Learning

Principles of Economics 2e
Economics
ISBN:
9781947172364
Author:
Steven A. Greenlaw; David Shapiro
Publisher:
OpenStax

Essentials of Economics (MindTap Course List)
Economics
ISBN:
9781337091992
Author:
N. Gregory Mankiw
Publisher:
Cengage Learning