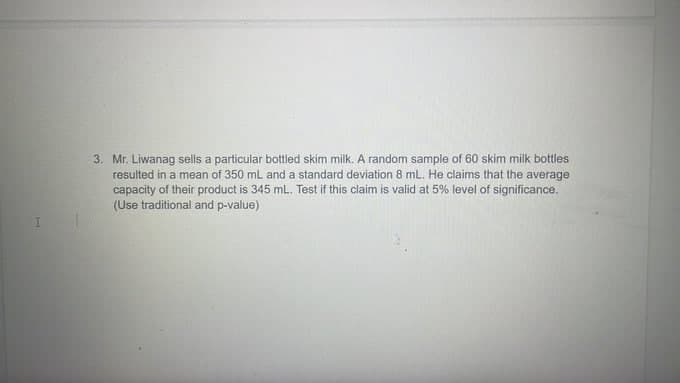
3. Mr. Liwanag sells a particular bottled skim milk. A random sample of 60 skim milk bottles resulted in a mean of 350 mL and a standard deviation 8 mL. He claims that the average capacity of their product is 345 mL. Test if this claim is valid at 5% level of significance. (Use traditional and p-value)
Q: nh 30 Frequency 1 2 O 10 20 40 LEAD T 50 60 70 80 Data were collected on the lead levels of children…
A: Introduction A histogram is a type of graph which consists of data points which is organized into…
Q: For the data shown above, find the following. Round answer in the first blank to 3 decimal place(s).…
A: X is a discrete random variable, then some measures like mean ,median ,mode in central tendency and…
Q: a. Use the given information to complete the following table: Laptop Type Frequency Relative…
A: It is given that Total students = 40 The number of students who using laptop HP = 16 Lenovo = 11…
Q: 23. Data is provided on a random sample of gymnasts competing the 2012 London Olympics. Answer the…
A: Given The data is as follows: Males: 26, 24, 26, 23, 20, 20, 23, 19, 33, 22, 18, 26 Females: 17, 22,…
Q: For a normal distribution with u = 140, o = 20 and X = 200, the value of the corresponding…
A: The information provided in the question are as follows : Mean (µ) = 140 Standard deviation (σ) = 20…
Q: The weights of a certain brand of candies are normally distributed with a mean weight of 0.8546 g…
A: Given information: With a mean weight of 0.8546 g and a standard deviation of 0.0517 g, the weight…
Q: (a) What is the five number summary for this data?itales de lo coltoob. (font) bus) (b) Check if…
A: The data is given from 18 diabetics enrolled in a diabetes control class. Sample size (n) = 18 To…
Q: A group of 40 students in a library was sampled and the type of laptop they were using was examined.…
A: Given Information: HP=16Lenovo=10Dell=6Microsoft=5Apple=3
Q: How do you determine if a strong positive or negative correlation exists between two variables using…
A: Correlation is a measure that indicates the strength and direction of association between two…
Q: Was this a mistake? What reasons are there for thinking that a natural experiment is more likely to…
A: It may not necessarily be a mistake, as both random assignment experiments and the natural…
Q: Fatima has applied to study for her bachelor's at Zayed University and at UAE University. Let Z and…
A: Given that Joint pmf of X and Y is U U* Total Z 0.2 Z* 0.8 Total 0.3 0.7 1
Q: The systolic blood pressure dataset (in the third sheet of the spreadsheet linked above) contains…
A: The data shows the age and systolic blood pressure of 30 randomly selected patients in a medical…
Q: The following stem-and-leaf plot is constructed using data collected from the speed (km/h) of cars…
A: Stem and leaf : It is similar to histogram, It represents quantitative data in graphical format.…
Q: The number of M&Ms of each color that were found in a case with 1848 M&Ms is given in the table…
A: Since you have asked multiple questions, we will solve the first question for you. If you want any…
Q: A box contains 4 black balls and 6 white balls and 2 green. If 3 balls are drawn without…
A: GivenA box containsNo.of black balls=4No.of white balls=6No.of green balls=2Total no.of balls=12
Q: What is the range of values that the Spearman's rank correlation coefficient (ρ) can take?
A: The range of values that the Spearman's rank correlation coefficient (ρ) can take is between -1 and…
Q: A probability model is simply a list of outcomes and the probability of each outcome. Which of the…
A: We know that the probability model satisfy the following conditions; All the probabilities in the…
Q: 0.0000 was incorrect. is there another way to get the answer?
A:
Q: • Example: A physical therapist wished to estimate, with 99 percent confidence, the mean maximal…
A: From the provided information, Sample size (n) = 15 Population variance (σ2) = 144 Sample mean (x̄)…
Q: A survey of 100 fatal accidents showed that 44 were alcohol related. Then a point estimate for the…
A: We have given that Sample size (n) = 100 x = 44
Q: 5. For page 18 of chapter 9 notes, an example asks for a confidence interval for the population…
A: Suppose x be the size And y be the selling price We have given the house price data as below,…
Q: Consider the data. X: 2 6 9 13 18 11 27 21 The estimated regression equation for these data is ŷ…
A: The question is about regression Given : Reg. eq. : y^ = 8.8 + ( 0.8 x ) To find : % of total…
Q: occurred most often? In how many classes were 2 students absent? How many times were no more than 2…
A: Answer:- Given ungrouped frequency table- Number of Absent Number of Classes 0 2 1 3 2 5…
Q: (c) What is its variance? 0.2478 (d) What is its cumulative-distribution function? X x < 0 0 < x < 1…
A: It is given that in the part (a) solution: P(X = 0) = 0.7189, 0 ≤ x < 1 P(X = 1) = 0.2622,…
Q: CAN SOMEONE HELP ME MAKE GRAPHICAL REPRESENTATION OF EACH TABLE BELOW AND EXPLAIN THE GRAPH FOR…
A: Since you have posted a question with multiple sub-parts, we will provide the solution only to the…
Q: Suppose we have three subgroups, and each subgroup consists of five samples drawn from the normal…
A: A point estimate is a specific real number that denotes to infer about a parameter from a sample on…
Q: er was incorrect
A: Given : Precision-cut wire (to be used in computer assembly) every hour for the past 24 hours has…
Q: We want to estimate the proportion of individuals in a population who are in favor of a certain bill…
A: Given that the margin of error is, ME=0.04
Q: A 3-sigma control chart is established and the following rule is used to detect out-of-control…
A: The 3 sigma control chart is established. The rule is as follows. 2 out of 3 consecutive points are…
Q: In a study of cell phone usage and brain hemispheric dominance, an Intemet survey was e-mailed to…
A: Given The data is as follows: α=0.01 Sample size, n=6994 No. of success, x=1311
Q: a) Suppose X, Y and Z are uncorrelated random variables with means 1, 2 and 3 and standard…
A: Given that V(X)=2, V(Y)=4, V(Z)=5
Q: 22. Ages from a random sample of 18 athletes in the 2012 London Olympics is provided below. Ages are…
A: Since you have posted a question with multiple sub-parts, we will provide the solution only to the…
Q: Question 14 The shape of Normal distribution and t-distribution is Symmetric O Skewed to right…
A: We have given the statement The shape of normal distribution and t-distribution is
Q: Differentiate between shape, location and scale parameters ?
A: Diffrentiation between shape, location and scale parameters.
Q: Age-related macular degeneration (AMD) is a common eye disease among the elderly that can lead to…
A: The relationship between AMD and the Y402H genotype is as follows: Y402H AMD=yes AMD=no…
Q: A hospital has determined that the average emergence time to reach a patient is 12 with a population…
A: Let X be the emergency time to reach a patient. The average emergency time to reach a patient is 12,…
Q: Research on shopping habits of the middle and high class ladies of a particular supermarket was…
A: Given information: Topic: Shopping behaviour of middle and high class ladies Groups: 1. Middle class…
Q: 1.8 1.5 2.6 2.1 2.5 2.3 2.6 3.0 1.3 2.3 With a 0.05 level of significance, test to see whether the…
A: It is given that the data values are 1.8, 1.5, 2.6, 2.1., 2.5, 2.3, 2.6, 3.0, 1.3, 2.3 Claim: The…
Q: Find the probability that it was not filed against united Airlines
A: We have given that Number of complaints filed against United Airlines = 1172 Total number of…
Q: Describe each of the 3 of your variables (two independent and one dependent) by calculating and…
A: Given Dependent variable Years Independent Variable Homicides Computing 1 measures of…
Q: Let X = number of email you receive in an hour. Assume that X follows the Poisson distribution with…
A: The random variable X is the number of emails you receive in an hour. X~P(λ=5) The p.m.f. of the…
Q: Quick Quiz: Conduct a formal hypothesis test of the claim that there is a linear correlation between…
A: We have given data, Productivity Dexterity 23 49 25 53 28 59 21 42 21 47 25 53 26…
Q: The regression line, y = 23.4 -0.07x, passes the horizontal axis at 334.3 -0.07 O -23.4 0.07 23.4…
A:
Q: 5 students were given a test. The average and standard deviation of the 5 scores were found to be…
A:
Q: Suppose there are many students like Judy (apply to 10 colleges, probability of acceptance is .4,…
A: Given that 10 colleges, probability of acceptance is 0.4 and number of acceptances is distributed…
Q: Question: Consider a sample of 100 test scores, with the following frequency distribution: Score…
A: score frequency 60-69 15 70-79 25 80-89 30 90-99 25 100 5
Q: Using Pearson correlation coefficient, the correlation between GPA and the aptitude exam score of…
A: It is required to find the correlation coefficient between Y (GPA) and X1 (aptitude exam).
Q: Every day new studies come out. Many results come out that are contradictory to one another.…
A: Statistics are of two broad branches, they are inferential and descriptive statistics. Inferential…
Q: 1. For page 8 of chapter 9 notes, what is the regression model? O y=30.81+3.540x Oy=a+bx O y…
A: The general simple linear regression equation is as follows. y^=a+bx y is the dependent variable. x…
Q: Given 2y + 3x = 5, find the value of y when x=3. Round your answer to two decimal places.
A: Given data 2y+3x = 5 we have to find value of y when x = 3.
Step by step
Solved in 2 steps