3. Prove the following: The arithmetic mean for grouped data is given by and m denote the frequency and mid-point respectively. 4. Define the following: Er' . where f
3. Prove the following: The arithmetic mean for grouped data is given by and m denote the frequency and mid-point respectively. 4. Define the following: Er' . where f

Glencoe Algebra 1, Student Edition, 9780079039897, 0079039898, 2018
18th Edition
ISBN:9780079039897
Author:Carter
Publisher:Carter
Chapter10: Statistics
Section10.3: Measures Of Spread
Problem 26PFA

Related questions
Question
Transcribed Image Text:21:50 P
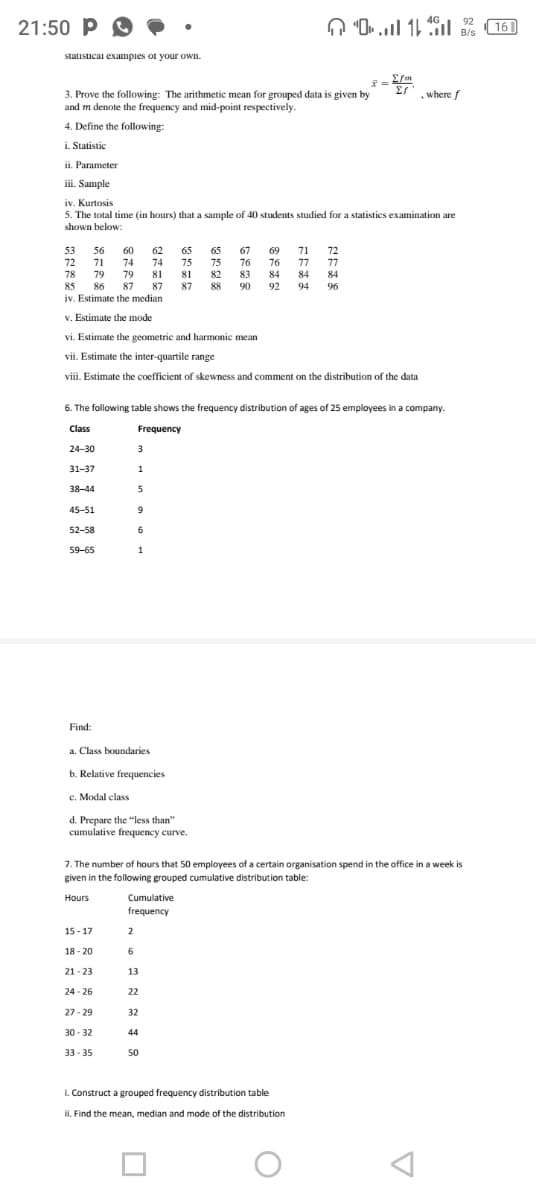
statistical examples of your own.
3. Prove the following: The arithmetic mean for grouped data is given by
and m denote the frequency and mid-point respectively.
4. Define the following:
i. Statistic
Parameter
53
72
78
ii.
iii. Sample
iv. Kurtosis
5. The total time (in hours) that a sample of 40 students studied for a statistics examination are
shown below:
56
71
24-30
31-37
38-44
45-51
52-58
59-65
Find:
79
85 86 87 87
iv. Estimate the median
v. Estimate the mode
vi. Estimate the geometric and harmonic mean
vii. Estimate the inter-quartile range
viii. Estimate the coefficient of skewness and comment on the distribution of the data
60 62
74 74 75
79 81 81
87
6. The following table shows the frequency distribution of ages of 25 employees in a company.
Class
Frequency
a. Class boundaries
b. Relative frequencies
c. Modal class
15-17
18-20
3
1
5
9
6
1
d. Prepare the "less than"
cumulative frequency curve.
21-23
24-26
27-29
30-32
33-35
Cumulative
frequency
65 65 67 69 71 72
76 76 77 77
83
84 84 84
90
92 94 96
2
6
13
7. The number of hours that 50 employees of a certain organisation spend in the office in a week is
given in the following grouped cumulative distribution table:
Hours
22
32
75
82
44
01
50
Σfm
x = 2m
27
i. Construct a grouped frequency distribution table
ii. Find the mean, median and mode of the distribution
, where f
O
92
B/s
16
Expert Solution
This question has been solved!
Explore an expertly crafted, step-by-step solution for a thorough understanding of key concepts.

Step by step
Solved in 3 steps with 1 images

Recommended textbooks for you
Glencoe Algebra 1, Student Edition, 9780079039897…
Algebra
ISBN:
9780079039897
Author:
Carter
Publisher:
McGraw Hill

Mathematics For Machine Technology
Advanced Math
ISBN:
9781337798310
Author:
Peterson, John.
Publisher:
Cengage Learning,
Glencoe Algebra 1, Student Edition, 9780079039897…
Algebra
ISBN:
9780079039897
Author:
Carter
Publisher:
McGraw Hill
Mathematics For Machine Technology
Advanced Math
ISBN:
9781337798310
Author:
Peterson, John.
Publisher:
Cengage Learning,