A sociologist is interested in the relation between x number of job changes and y annual salary (in thousands of dollars) for people living in the Nashville area. A random sample of 10 people employed in Nashville provided the following information. 4 5 6 1 5 3 37 9 10 10 3 43 37 40 33 38 32 1 32 23 32 38 (auchee, al joh.chragan) y (Salary in $1000) LAUSE SALT x=561 3621x²4021 y²13.2361; Exy - 2,093 (a) Find x, y, b, and the equation of the least-squares line. (Round your answers for and y to two decimal places. Round your least-squares estimates to three decimal places.) y= (b) Draw a scatter diagram for the data. Plot the least-squares line on your scatter diagram. 50 45 40 35 30 23 20 00 50 45 40 35 30 25 O 2 2 4 4 6 6 8 10 10 50 45 P 40+ 35 30 X 25 20 50 25 20 2 0 45 40 K 35 30 4 2 6 8 10 8 10 x X (e) Find the sample correlation coefficient and the coefficient of determination. (Round your answers to three decimal places.) 2. What percentage of variation in y is explained by the least-squares model? (Round your answer to one decimal place.)
A sociologist is interested in the relation between x number of job changes and y annual salary (in thousands of dollars) for people living in the Nashville area. A random sample of 10 people employed in Nashville provided the following information. 4 5 6 1 5 3 37 9 10 10 3 43 37 40 33 38 32 1 32 23 32 38 (auchee, al joh.chragan) y (Salary in $1000) LAUSE SALT x=561 3621x²4021 y²13.2361; Exy - 2,093 (a) Find x, y, b, and the equation of the least-squares line. (Round your answers for and y to two decimal places. Round your least-squares estimates to three decimal places.) y= (b) Draw a scatter diagram for the data. Plot the least-squares line on your scatter diagram. 50 45 40 35 30 23 20 00 50 45 40 35 30 25 O 2 2 4 4 6 6 8 10 10 50 45 P 40+ 35 30 X 25 20 50 25 20 2 0 45 40 K 35 30 4 2 6 8 10 8 10 x X (e) Find the sample correlation coefficient and the coefficient of determination. (Round your answers to three decimal places.) 2. What percentage of variation in y is explained by the least-squares model? (Round your answer to one decimal place.)

MATLAB: An Introduction with Applications
6th Edition
ISBN:9781119256830
Author:Amos Gilat
Publisher:Amos Gilat
Chapter1: Starting With Matlab
Section: Chapter Questions
Problem 1P

Related questions
Question
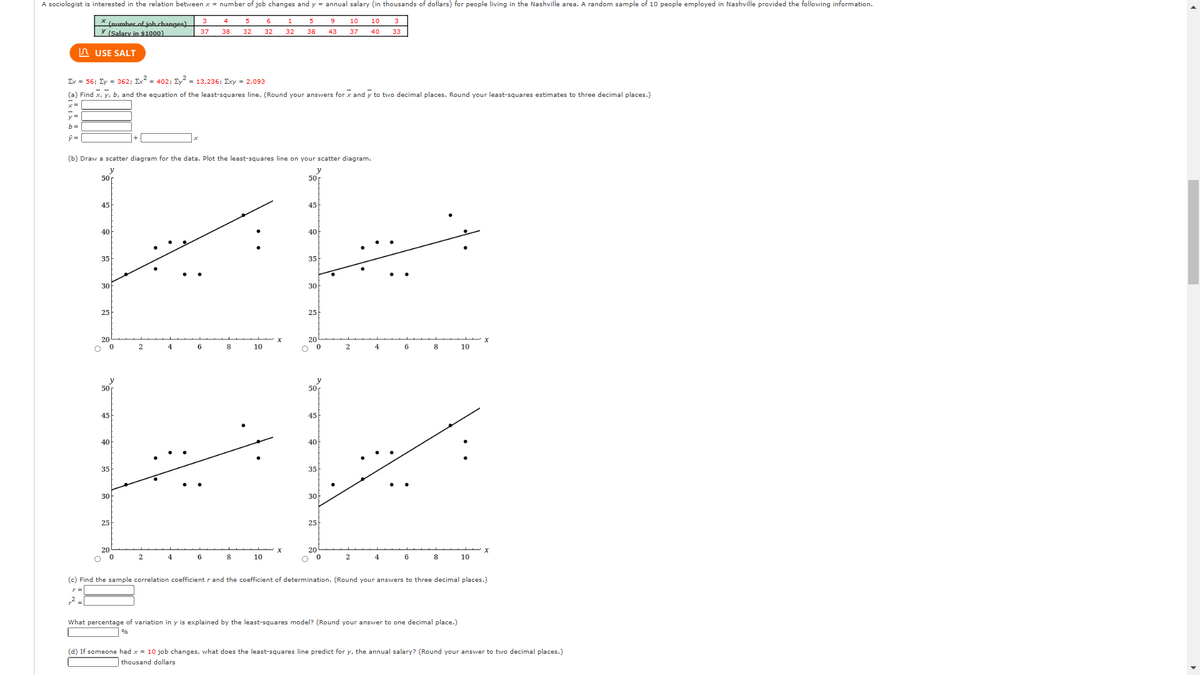
Transcribed Image Text:A sociologist is interested in the relation between x = number of job changes and y = annual salary (in thousands of dollars) for people living in the Nashville area. A random sample of 10 people employed in Nashville provided the following information.
5
38
9
43
10 10
37
* (number of joh changes)
y (Salary in $1000)
USE SALT
b=
ŷ =
50
Σx = 56; Σy = 362; Ex2 = 402; Σyλ = 13,236; Σxy = 2,093
(a) Find x, y, b, and the equation of the least-squares line. (Round your answers for x and y to two decimal places. Round your least-squares estimates to three decimal places.)
x=
45
40
(b) Draw a scatter diagram for the data. Plot the least-squares line on your scatter diagram.
y
35
30
25
O
0
50
45
y
40
35
30
O
25
2
3
37
4
2
4
5
6
38 32 32
6
6
8
1
32
10
8
10
50
45
40
35
y
50
45
40
PK
35
30
25
30
25
20
O
0
O
40 33
2
2
4
6
8
6
8
10
What percentage of variation in y is explained by the least-squares model? (Round your answer to one decimal place.)
%
10
(c) Find the sample correlation coefficient r and the coefficient of determination. (Round your answers to three decimal places.)
(d) If someone had x = 10 job changes, what does the least-squares line predict for y, the annual salary? (Round your answer to two decimal places.)
thousand dollars
Expert Solution
This question has been solved!
Explore an expertly crafted, step-by-step solution for a thorough understanding of key concepts.

This is a popular solution!

Trending now
This is a popular solution!

Step by step
Solved in 5 steps with 1 images

Recommended textbooks for you
MATLAB: An Introduction with Applications
Statistics
ISBN:
9781119256830
Author:
Amos Gilat
Publisher:
John Wiley & Sons Inc

Probability and Statistics for Engineering and th…
Statistics
ISBN:
9781305251809
Author:
Jay L. Devore
Publisher:
Cengage Learning

Statistics for The Behavioral Sciences (MindTap C…
Statistics
ISBN:
9781305504912
Author:
Frederick J Gravetter, Larry B. Wallnau
Publisher:
Cengage Learning
MATLAB: An Introduction with Applications
Statistics
ISBN:
9781119256830
Author:
Amos Gilat
Publisher:
John Wiley & Sons Inc
Probability and Statistics for Engineering and th…
Statistics
ISBN:
9781305251809
Author:
Jay L. Devore
Publisher:
Cengage Learning
Statistics for The Behavioral Sciences (MindTap C…
Statistics
ISBN:
9781305504912
Author:
Frederick J Gravetter, Larry B. Wallnau
Publisher:
Cengage Learning

Elementary Statistics: Picturing the World (7th E…
Statistics
ISBN:
9780134683416
Author:
Ron Larson, Betsy Farber
Publisher:
PEARSON

The Basic Practice of Statistics
Statistics
ISBN:
9781319042578
Author:
David S. Moore, William I. Notz, Michael A. Fligner
Publisher:
W. H. Freeman

Introduction to the Practice of Statistics
Statistics
ISBN:
9781319013387
Author:
David S. Moore, George P. McCabe, Bruce A. Craig
Publisher:
W. H. Freeman