3. Shifts in production possibilities Suppose the United States produces two types of goods: agricultural and capital. The following diagram shows its current production possibilities curve (also knovin as the production possibilities curve) for corn, an agricultural good, and airplanes, a capital good. Drag the production possibilities curve (PPC) on the graph to show the effects of an improvement in soil quality because of new fertilization techniques. Note: Select either end of the curve on the graph to make the endpoints appear. Then drag one or both endpoints to the desired position. Points vill snap into position, so if you try to move a point and it snaps back to its original position, just drag it a little farther. 420 350 PPC 200 210 140 70 PPC 40 a0 120 160 200 240 CORN (Millions of bushels) AIRPLANES (Thous ands)
3. Shifts in production possibilities Suppose the United States produces two types of goods: agricultural and capital. The following diagram shows its current production possibilities curve (also knovin as the production possibilities curve) for corn, an agricultural good, and airplanes, a capital good. Drag the production possibilities curve (PPC) on the graph to show the effects of an improvement in soil quality because of new fertilization techniques. Note: Select either end of the curve on the graph to make the endpoints appear. Then drag one or both endpoints to the desired position. Points vill snap into position, so if you try to move a point and it snaps back to its original position, just drag it a little farther. 420 350 PPC 200 210 140 70 PPC 40 a0 120 160 200 240 CORN (Millions of bushels) AIRPLANES (Thous ands)

Micro Economics For Today
10th Edition
ISBN:9781337613064
Author:Tucker, Irvin B.
Publisher:Tucker, Irvin B.
Chapter2: Productions Possibilities, Opportunity Costs, And Economic Growth
Section: Chapter Questions
Problem 11SQP

Related questions
Question
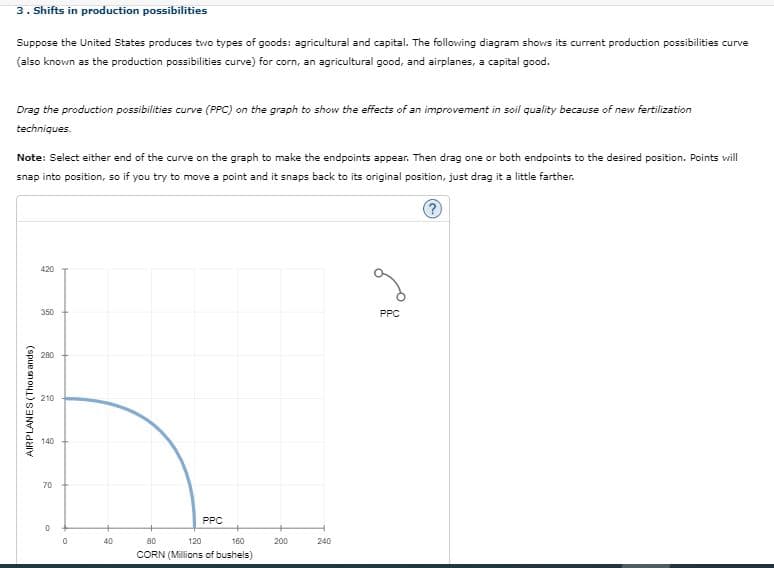
Transcribed Image Text:3. Shifts in production possibilities
Suppose the United States produces two types of goods: agricultural and capital. The following diagram shows its current production possibilities curve
(also known as the production possibilities curve) for corn, an agricultural good, and airplanes, a capital good.
Drag the production possibilities curve (PPC) on the graph to show the effects of an improvement in soil quality because of new fertilization
techniques.
Note: Select either end of the curve on the graph to make the endpoints appear. Then drag one or both endpoints to the desired position. Points vill
snap into position, so if you try to move a point and it snaps back to its original position, just drag it a little farther.
420
350
PPC
280
210
140
70 +
PPC
40
80
120
160
200
240
CORN (Millions of bushels)
AIRPLANES (Thous ands)
Expert Solution
This question has been solved!
Explore an expertly crafted, step-by-step solution for a thorough understanding of key concepts.

This is a popular solution!

Trending now
This is a popular solution!

Step by step
Solved in 2 steps with 1 images

Recommended textbooks for you


Economics Today and Tomorrow, Student Edition
Economics
ISBN:
9780078747663
Author:
McGraw-Hill
Publisher:
Glencoe/McGraw-Hill School Pub Co
Economics Today and Tomorrow, Student Edition
Economics
ISBN:
9780078747663
Author:
McGraw-Hill
Publisher:
Glencoe/McGraw-Hill School Pub Co

Essentials of Economics (MindTap Course List)
Economics
ISBN:
9781337091992
Author:
N. Gregory Mankiw
Publisher:
Cengage Learning

