3. Suppose the following equation characterize supply and demand in the labor market model: labor supply: L* = 1+ w labor demand: L = 11 - w Equilibrium occurs at an employment level L* and a wage uw* so that the labor market clears. What is the equilibrium value of wage and labor in this model? a) w 1/5, L' = 4/5 b) w* = 6, L* = 5 c) w* = 5, L = 6 d) w = 6, L* = 6 e) Not enough information is given.
3. Suppose the following equation characterize supply and demand in the labor market model: labor supply: L* = 1+ w labor demand: L = 11 - w Equilibrium occurs at an employment level L* and a wage uw* so that the labor market clears. What is the equilibrium value of wage and labor in this model? a) w 1/5, L' = 4/5 b) w* = 6, L* = 5 c) w* = 5, L = 6 d) w = 6, L* = 6 e) Not enough information is given.

Brief Principles of Macroeconomics (MindTap Course List)
8th Edition
ISBN:9781337091985
Author:N. Gregory Mankiw
Publisher:N. Gregory Mankiw
Chapter10: Unemployment
Section: Chapter Questions
Problem 10PA

Related questions
Question
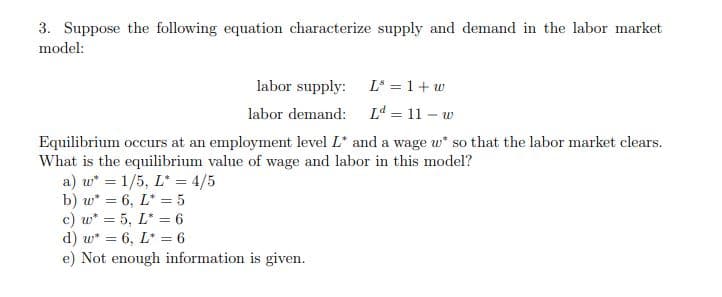
Transcribed Image Text:3. Suppose the following equation characterize supply and demand in the labor market
model:
labor supply: L = 1 + w
labor demand: L = 11 – w
Equilibrium occurs at an employment level L* and a wage w* so that the labor market clears.
What is the equilibrium value of wage and labor in this model?
a) w* = 1/5, L* = 4/5
b) w* = 6, L* = 5
c) w* = 5, L* = 6
d) w* = 6, L* = 6
e) Not enough information is given.
Expert Solution
This question has been solved!
Explore an expertly crafted, step-by-step solution for a thorough understanding of key concepts.

This is a popular solution!

Trending now
This is a popular solution!

Step by step
Solved in 2 steps

Knowledge Booster


Learn more about
Need a deep-dive on the concept behind this application? Look no further. Learn more about this topic, economics and related others by exploring similar questions and additional content below.Recommended textbooks for you
Brief Principles of Macroeconomics (MindTap Cours…
Economics
ISBN:
9781337091985
Author:
N. Gregory Mankiw
Publisher:
Cengage Learning

Essentials of Economics (MindTap Course List)
Economics
ISBN:
9781337091992
Author:
N. Gregory Mankiw
Publisher:
Cengage Learning

Brief Principles of Macroeconomics (MindTap Cours…
Economics
ISBN:
9781337091985
Author:
N. Gregory Mankiw
Publisher:
Cengage Learning
Essentials of Economics (MindTap Course List)
Economics
ISBN:
9781337091992
Author:
N. Gregory Mankiw
Publisher:
Cengage Learning