3. The consumption function Suppose that national income in a country is $300 billion, taxes paid by households are $100 billion, household consumption is $160 billion, and the marginal propensity to consume (MPC) is 0.6. On the following graph, use the blue line (circle symbol) to plot the economy's consumption function. CONSUMPTION (Billions of dollars) 500 450 400 350 300 250 200 150 100 50 0 0 50 100 150 200 250 300 350 400 450 500 DISPOSABLE INCOME (Billions of dollars) Suppose now that country's national income increases to $330 billion. Assuming the amount paid in taxes is fixed at $100 billion and that MPC = 0.6, what will be the new household consumption? $220.6 billion $178 billion $148 billion Consumption Function O $219.4 billion
3. The consumption function Suppose that national income in a country is $300 billion, taxes paid by households are $100 billion, household consumption is $160 billion, and the marginal propensity to consume (MPC) is 0.6. On the following graph, use the blue line (circle symbol) to plot the economy's consumption function. CONSUMPTION (Billions of dollars) 500 450 400 350 300 250 200 150 100 50 0 0 50 100 150 200 250 300 350 400 450 500 DISPOSABLE INCOME (Billions of dollars) Suppose now that country's national income increases to $330 billion. Assuming the amount paid in taxes is fixed at $100 billion and that MPC = 0.6, what will be the new household consumption? $220.6 billion $178 billion $148 billion Consumption Function O $219.4 billion

Chapter9: Aggregate Demand
Section: Chapter Questions
Problem 1.1P

Related questions
Question
9
Transcribed Image Text:Attempts
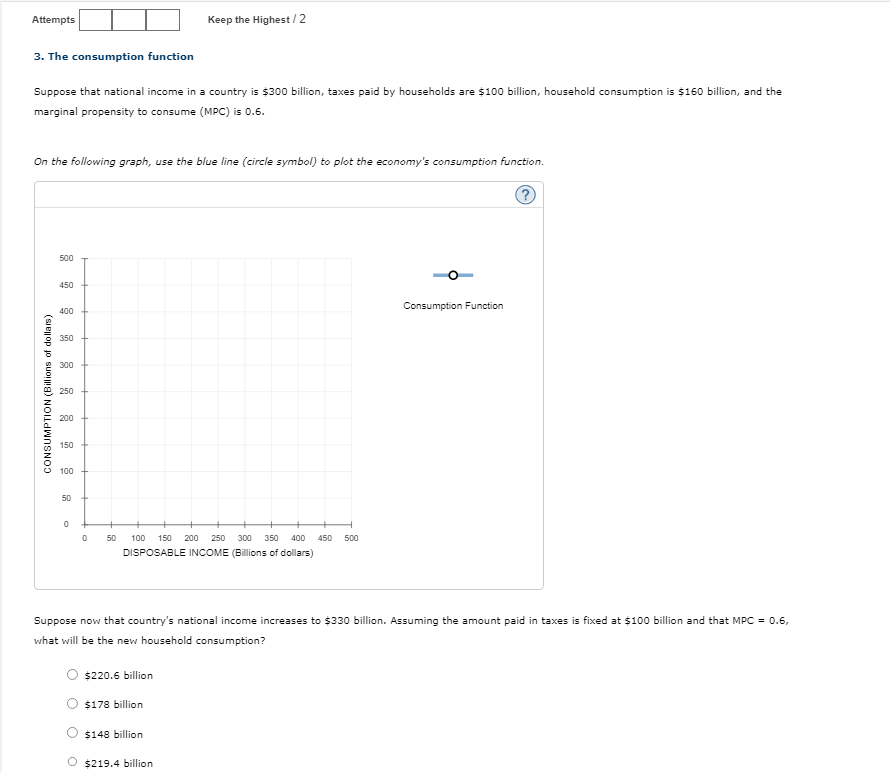
3. The consumption function
Suppose that national income in a country is $300 billion, taxes paid by households are $100 billion, household consumption is $160 billion, and the
marginal propensity to consume (MPC) is 0.6.
On the following graph, use the blue line (circle symbol) to plot the economy's consumption function.
CONSUMPTION (Billions of dollars)
500
450
400
350
300
250
200
150
100
50
0
+
0
Keep the Highest/2
50 100 150 200 250 300 350 400 450 500
DISPOSABLE INCOME (Billions of dollars)
$220.6 billion
$178 billion
Suppose now that country's national income increases to $330 billion. Assuming the amount paid in taxes is fixed at $100 billion and that MPC = 0.6,
what will be the new household consumption?
$148 billion
$219.4 billion
Consumption Function
Expert Solution
This question has been solved!
Explore an expertly crafted, step-by-step solution for a thorough understanding of key concepts.

This is a popular solution!

Trending now
This is a popular solution!

Step by step
Solved in 4 steps with 1 images

Knowledge Booster


Learn more about
Need a deep-dive on the concept behind this application? Look no further. Learn more about this topic, economics and related others by exploring similar questions and additional content below.Recommended textbooks for you


Macroeconomics: Principles and Policy (MindTap Co…
Economics
ISBN:
9781305280601
Author:
William J. Baumol, Alan S. Blinder
Publisher:
Cengage Learning

Brief Principles of Macroeconomics (MindTap Cours…
Economics
ISBN:
9781337091985
Author:
N. Gregory Mankiw
Publisher:
Cengage Learning

Essentials of Economics (MindTap Course List)
Economics
ISBN:
9781337091992
Author:
N. Gregory Mankiw
Publisher:
Cengage Learning