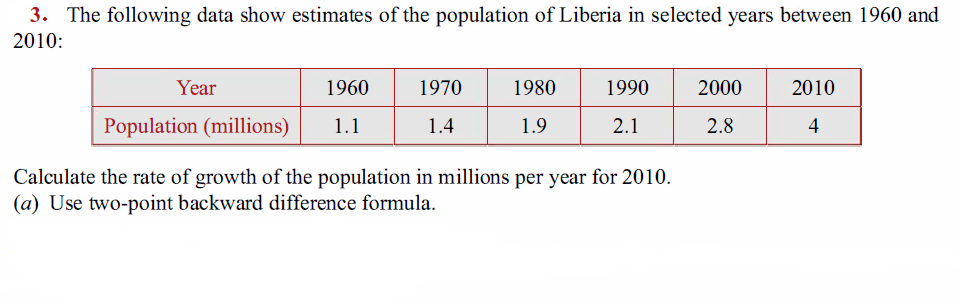
3. The following data show estimates of the population of Liberia in selected years between 1960 and 2010: Year 1960 1970 1980 1990 2000 2010 Population (millions) 1.1 1.4 1.9 2.1 2.8 4 Calculate the rate of growth of the population in millions per year for 2010. (a) Use two-point backward difference formula.
3. The following data show estimates of the population of Liberia in selected years between 1960 and 2010: Year 1960 1970 1980 1990 2000 2010 Population (millions) 1.1 1.4 1.9 2.1 2.8 4 Calculate the rate of growth of the population in millions per year for 2010. (a) Use two-point backward difference formula.

Chapter6: Exponential And Logarithmic Functions
Section6.7: Exponential And Logarithmic Models
Problem 16TI: Recent data suggests that, as of 2013, the rate of growth predicted by Moore’s Law no longer holds....

Related questions
Question
Numerical Methods
Transcribed Image Text:3. The following data show estimates of the population of Liberia in selected years between 1960 and
2010:
Year
1960
1970
1980
1990
2000
2010
Population (millions)
1.1
1.4
1.9
2.1
2.8
4
Calculate the rate of growth of the population in millions per year for 2010.
(a) Use two-point backward difference formula.
Expert Solution
This question has been solved!
Explore an expertly crafted, step-by-step solution for a thorough understanding of key concepts.

This is a popular solution!

Trending now
This is a popular solution!

Step by step
Solved in 2 steps

Knowledge Booster


Learn more about
Need a deep-dive on the concept behind this application? Look no further. Learn more about this topic, advanced-math and related others by exploring similar questions and additional content below.Recommended textbooks for you

Functions and Change: A Modeling Approach to Coll…
Algebra
ISBN:
9781337111348
Author:
Bruce Crauder, Benny Evans, Alan Noell
Publisher:
Cengage Learning
Functions and Change: A Modeling Approach to Coll…
Algebra
ISBN:
9781337111348
Author:
Bruce Crauder, Benny Evans, Alan Noell
Publisher:
Cengage Learning