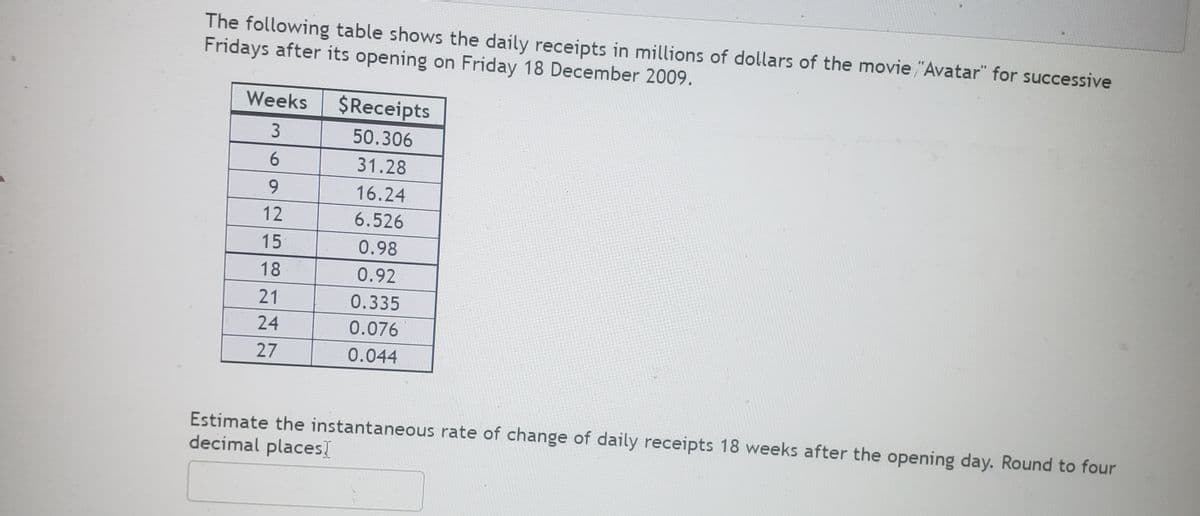
The following table shows the daily receipts in millions of dollars of the movie "Avatar" for successive Fridays after its opening on Friday 18 December 2009. Weeks $Receipts 50.306 31.28 9. 16.24 6.526 15 0.98 18 0.92 21 0.335 24 0.076 27 0.044 Estimate the instantaneous rate of change of daily receipts 18 weeks after the opening day. Round to four decimal places 25 co 7


Q: With the gasoline time series data from the given table, show the exponential smoothing forecasts…
A:
Q: Suppose the following table shows the approximate price of a certain stock in December of each year…
A: The 4-yearly moving averages are computed by taking the average of the 4 year data and writing it…
Q: The U.S. Bureau of the Census prediction for the percentage of the population 65 years and older can…
A: First of all, differentiate p(x) w.r.t. x and get p '(x).A derivative of a function shows the…
Q: With data from the Social Security Trustees Report for selected years from 1950 and projected to…
A:
Q: The U.S. Bureau of the Census prediction for the percentage of the population 65 years and older can…
A:
Q: For the Hawkins Company, the monthly percentages of all shipments received on time over the past 12…
A: The Moving average forecast of order k is obtained by the formula- Ft+1=Ft+Ft-1+...+Ft-k+1k The…
Q: With data from the Social Security Trustees Report for selected years from 1950 and projected to…
A: The average value of a function f(x) in some interval [a,b] is given by: favg.=1b-a∫abf(x) dx
Q: The following table shows the daily receipts in millions of dollars of the movie "Avatar" for…
A: For x= 23 weeks, a= 20 weeks f(a)= 0.425 and also, b= 26 weeks f(b)= 0.045 Which is the interval of…
Q: The following table shows the daily receipts in millions of dollars of the movie "Avatar" for…
A: Consider the points 19,0.633,21,0.335,23,0.12,25,0.064 and 27,0.044. Find the Average rate of change…
Q: Consider the following data:Monthly Profit of an Auto Repair Shop Month Jan-14 Feb-14 Mar-14…
A: The exponential smoothing forecast for the next time period (Oct-14) is 19,193.2 and it is…
Q: The following table gives the approximate increase in the average price of a movie ticket every two…
A: given that and the price of movie ticket in 2004 is $6.99. we have to find…
Q: The following table represents Canada's population in specific years over the last century. Year…
A:
Q: The following table gives the approximate price increase (in dollars) of a liter of soy sauce for…
A: We can find the net change as below
Q: With data from the Social Security Trustees Report for selected years from 1950 and projected to…
A:
Q: The sales trend has been modeled as: Sales-2°t+200, where te time in quarters, beginning in Q1 2010.…
A: Here, The formula for the quarters is 2*t+200, t is the time in quarters beginning Q1 of 2010.
Q: With data from the Social Security Trustees Report for selected years from 1950 and projected to…
A: Consider the given function. Bt=0.00024t3-0.026t2+1.6t+2.2 The average value is defined as.…
Q: The following graph approximates the amount of milk produced per cow in the United States for the…
A: From the graph we find that Amount of milk in 1996 = 16,400 pounds Amount of milk in 2005 = 19,820…
Q: The following table shows a company's annual revenue (in billions of dollars) for 2009 to 2014.…
A:
Q: With data from the Social Security Trustees Report for selected years from 1950 and projected to…
A:
Q: With data from the Social Security Trustees Report for selected years from 1950 and projected to…
A: The number of social security beneficiaries is given by the model : B(t)=0.00024 t3 - 0.026 t2 +1.6…
Q: The following table shows the daily receipts and millions of dollars of the movie avatar for…
A:
Q: Consider the following time series data for the real consumption of households and government, at…
A: Time series defined as the depending on time. The data is arranged in a chronological order of time.…
Q: With data from the Social Security Trustees Report for selected years from 1950 and projected to…
A:
Q: The table below shows the number of Facebook users, N (in millions), worldwide at 3-month intervals.…
A: Average rate of change= Total change in number of users / change in months
Q: The following table shows daily offshore crude oil production by a country's national oil company,…
A:
Q: With data from the Social Security Trustees Report for selected years from 1950 and projected to…
A: Disclaimer: "Since you have asked multiple questions, we will solve the first question for you. If…
Q: The following table lists remaining life expectancy, E, in years for females of age x. x (yг) | 50…
A: Given for x1=50 ⇒E1=33.8and for x2=60 ⇒ E2=25.2
Q: The values of Alabama building contracts (in $ millions) for a 12 -month period follow. 240 350…
A: The values of Alabama building contracts (in $ millions) for a 12 -month period are: 240 350 240…
Q: The following table lists remaining life expectancy, E, in years for females of age x. x (yr) 50 60…
A: We have life expectancy E in years for females of age x. We have given Life expectancy, Eyr=33.8 for…
Q: The following table shows the daily receipts in millions of dollars of the movie "Avatar" for…
A: Given: The daily receipts in millions of dollars of a movie for successive Fridays is given on the…
Q: The following table shows the daily receipts in millions of dollars of the movie "Avatar for…
A:
Q: Consider the following end of year prices, rounded to a dollar of DGT (SPDR Global Dow) - 150…
A: Singer - Terhaar model is a financial equilibrium model that uses ICAPM Step 1: Calculate the…
Q: For the Hawkins Company, the monthly percentages of all shipments received on time over the past 12…
A: Given Data : Month Data 1 80 2 81 3 85 4 83 5 84 6 86 7 85 8 85 9 82 10 81…
Q: The following table shows the daily receipts in millions of dollars of the movie "The Hunger Games"…
A:
Q: With data from the Social SecurityY Trustees Report for selected years from 1950 and projected to…
A:
Q: The table below gives the annual sales.(in millions) of a product. year 2013 2014 2015 2016 2017…
A:
Q: survey as to how long customers claimed to wait in the checkout line until their turn. Let X = time…
A:
Q: The president of State University wants to forecast student enrollment for this academic year based…
A: Formula for Calculating Present year forecast : Ft=Ft-1 +αAt-1-Ft-1 Where t is the present year, and…
Q: With data from the Social Security Trustees Report for selected years from 1950 and projected to…
A: Given the number of Social security beneficiaries is modeled by: Bt=0.00024t3−00.026t2+1.6t+2.2…
Q: Storrs Cycles has just started selling the new Cyclonemountain bike, with monthly sales as shown in…
A: a) Using excel for performing regression with Sales as the dependent variable and period as…
Q: Express the rate of inflation from 1985 to 2015 as a percent correct to two decimal places. Year…
A: To find - Express the rate of inflation from 1985 to 2015 as a percent correct to two decimal…
Q: e 48 The seasonal indices of the sale of ready-made garments of a parti- cular type in a certain…
A:
Q: The following table shows timber stumpage prices for pine pulpwood in two regions of the American…
A: Disclaimer: Since you have posted a question with multiple sub-parts, we will solve first three…
Q: 1
A: Given thatAccording to Malthus, with diminishing average product of labour in production and…
Q: The table below gives the sales, S, of Intel Corporation, a leading manufacturer of integrated…
A:
Q: The following table shows the daily receipts in millions of dollars of the movie "Avatar" for…
A: The following data is given: Weeks $Receipts 2 68.49 4 45.785 6 31.28 8 23.611 10…
Q: The following table shows the daily receipts in millions of dollars of the movie "Avatar" for…
A: The following table shows the daily receipts in millions of dollars of the movie "avatar" for…
Q: The following table shows the daily receipts in millions of dollars of the movie "The Hunger Games"…
A:
Q: The following table shows the daily receipts in millions of dollars of the movie "The Hunger Games"…
A: Given data, Days $Receipts 0 152.535 14 33.111 28 14.666 42 5.587 56 2.95 70 1.567…
Q: ... ... With data from the Social Security Trustees Report for selected years from 1950 and…
A: a) 0.746 b) 1.573


Trending now
This is a popular solution!

Step by step
Solved in 2 steps with 1 images

- The following table shows the daily receipts in millions of dollars of the movie "The Hunger Games" after its opening on 23 March 2012. Days $Receipts 0 152.535 14 33.111 28 14.666 42 5.587 56 2.95 70 1.567 84 0.852 98 0.397 112 0.279 126 0.518 Estimate the instantaneous rate of change of the daily receipts on day 70.Over the past 14 months,the monthly percentages of all shipments received on time are Monthy Proportion of On Time Shipments7281789083859082898185847888 What is MSE using exponential smoothing forecast for α=0.3? (keep 2 decimal points)The following table shows the daily receipts in millions of dollars of the movie "The Hunger Games" after its opening on 23 March 2012. Days $Receipts 14 33.111 28 14.666 42 5.587 56 2.95 70 1.567 84 0.852 98 0.397 112 0.279 126 0.518 Find the average rate of change of the daily receipts from day 56 to day 84.
- The following table shows the daily receipts in millions of dollars of the movie "Avatar" for successive Fridays after its opening on Friday 18 December 2009. Weeks $Receipts 2 68.49 4 42.785 6 31.28 8 23.611 10 13.655 12 6.526 14 2.047 16 0.844 18 0.92 20 0.425 22 0.188 24 0.076 26 0.045 28 0.028 Estimate the instantaneous rate of change of daily receipts 14 weeks after the opening day. Round to four decimal places..Over the past 14 months,the monthly percentages of all shipments received on time are Monthy Proportion of On Tme Shipments 72 81 78 90 83 85 90 82 89 81 85 84 78 88 What is MSE using exponential smoothing forecast for α=0.3? (keep 2 decimal points)A pizza chain has had sales for take-out food over the last four evenings—Monday, Tuesday, Wednesday, and Thursday—of 29, 25, 35, and 30 pizzas, respectively.What would be their forecast for Friday using an exponential smoothing forecastingapproach? Use α = 0.2 and a forecast for Monday of 28.
- The analysis of tooth shrinkage byC. Loring Brace and colleagues at the University of Michigan’s Museum of Anthropology indicates that human tooth size is continuingto decrease and that the evolutionary process has not yetcome to a halt. In northern Europeans, for example, tooth sizereduction now has a rate of 1% per 1000 years. What will be our descendants’ tooth size 20,000 years from now (as a percentage of our present tooth size)?Below is a table containing data on product demand for the most recent five months along with the forecasts that had been made for those 5 previous months. Use the exponential smoothing method to forecast the number of sales to expect next month. Use the following value of alpha: 0.2. Month Demand Forecast 1 308 349.2 2 388 340.9 3 344 350.3 4 400 349.1 5 341 359.3The manager of a supermarket tracked the amount of time needed for customers to be served by the cashier. After checking with his statistics professor, he concluded that the checkout times are exponentially distributed with a mean of 5 minutes. What propotion of customers require more than 10 minutes to check out?
- For the hawkins company, the monthly percentages of all shipments received on timeover the past 12 months are 80, 82, 84, 83, 83, 84, 85, 84, 82, 83, 84, and 83.a. construct a time series plot. What type of pattern exists in the data?b. compare the three-month moving average approach with the exponential smoothing approach for a = .2. Which provides more accurate forecasts using MSe as themeasure of forecast accuracy?The following table gives profits (in ten thousands of shillings) of two supermarkets over a duration of one year. Determine which supermarket has a greater variability of its profits.According to a high-profile realtor, houses in the sleepy town of Sun Beach have shown higher appreciation over the past three years than have houses in the bustling town of North Arden. To test the realtor's claim, an economist has found eight recently sold homes in Sun Beach and eight recently sold homes in North Arden that were owned for exactly three years. The following table gives the appreciation (expressed as a percentage increase) for each of the sixteen houses. Appreciation rates in percent Sun Beach 10.2, 9.7, 12, 10.4, 7.9, 10.9, 9.6, 13.3 North Arden 7.5, 12.8, 5.9, 8.5, 8.1, 9.3, 6.3, 13.4 Assume that the two populations of appreciation rates are normally distributed and that the population variances are equal. Can we conclude, at the 0.05 level of significance, that houses in Sun Beach have higher appreciation over the past three years than houses in North Arden? Perform a one-tailed test. The null hypothesis: H0:…