FIGURE 14.2 Four Economic Time Serles Percent Dollars per pound 11r 1아 3.0r 2.5 2.아 1.5- 1.0 0.5 - 0.0L 1960 1970 1980 1990 2000 2010 2012 1960 1970 1980 1990 2000 2010 2012 (a) U.S. Unemployment Rate (b) U.S. Dollar/British Pound Exchange Rate Percent per day Logarithm 12.5 5.0r 10.0 7.5 4.5- 5.0 2.5 4.0- 0.0 3.5- -2.5 -5.0 3.0- -7.5 25 1960 1970 1980 1990 2000 2010 2012 -10.0 1990 1994 1998 2002 2006 2010 (c) Logarithm of Index of Industrial Production in Japan (d) Percentage Change in Daily Values of the Wilshire 5000 Stock Price Index The four time series have markedly different patterns. The unemployment rate (Figure 14.2a) increases during recessions and declines during recoveries and expansions. The exchange rate between the U.S. dollar and the British pound (Figure 14.2b) shows a discrete change after the 1972 collapse of the Bretton Woods system of fixed exchange rates. The logarithm of the index of industrial production in Japan (Figure 14.2c) shows a pat- tern of decreasing growth. The daily percentage changes in the Wilshire 5000 stock price index (Figure 14.2d) are essentially unpredictable, but the variance changes: This series shows "volatility clustering."
FIGURE 14.2 Four Economic Time Serles Percent Dollars per pound 11r 1아 3.0r 2.5 2.아 1.5- 1.0 0.5 - 0.0L 1960 1970 1980 1990 2000 2010 2012 1960 1970 1980 1990 2000 2010 2012 (a) U.S. Unemployment Rate (b) U.S. Dollar/British Pound Exchange Rate Percent per day Logarithm 12.5 5.0r 10.0 7.5 4.5- 5.0 2.5 4.0- 0.0 3.5- -2.5 -5.0 3.0- -7.5 25 1960 1970 1980 1990 2000 2010 2012 -10.0 1990 1994 1998 2002 2006 2010 (c) Logarithm of Index of Industrial Production in Japan (d) Percentage Change in Daily Values of the Wilshire 5000 Stock Price Index The four time series have markedly different patterns. The unemployment rate (Figure 14.2a) increases during recessions and declines during recoveries and expansions. The exchange rate between the U.S. dollar and the British pound (Figure 14.2b) shows a discrete change after the 1972 collapse of the Bretton Woods system of fixed exchange rates. The logarithm of the index of industrial production in Japan (Figure 14.2c) shows a pat- tern of decreasing growth. The daily percentage changes in the Wilshire 5000 stock price index (Figure 14.2d) are essentially unpredictable, but the variance changes: This series shows "volatility clustering."

MATLAB: An Introduction with Applications
6th Edition
ISBN:9781119256830
Author:Amos Gilat
Publisher:Amos Gilat
Chapter1: Starting With Matlab
Section: Chapter Questions
Problem 1P

Related questions
Question
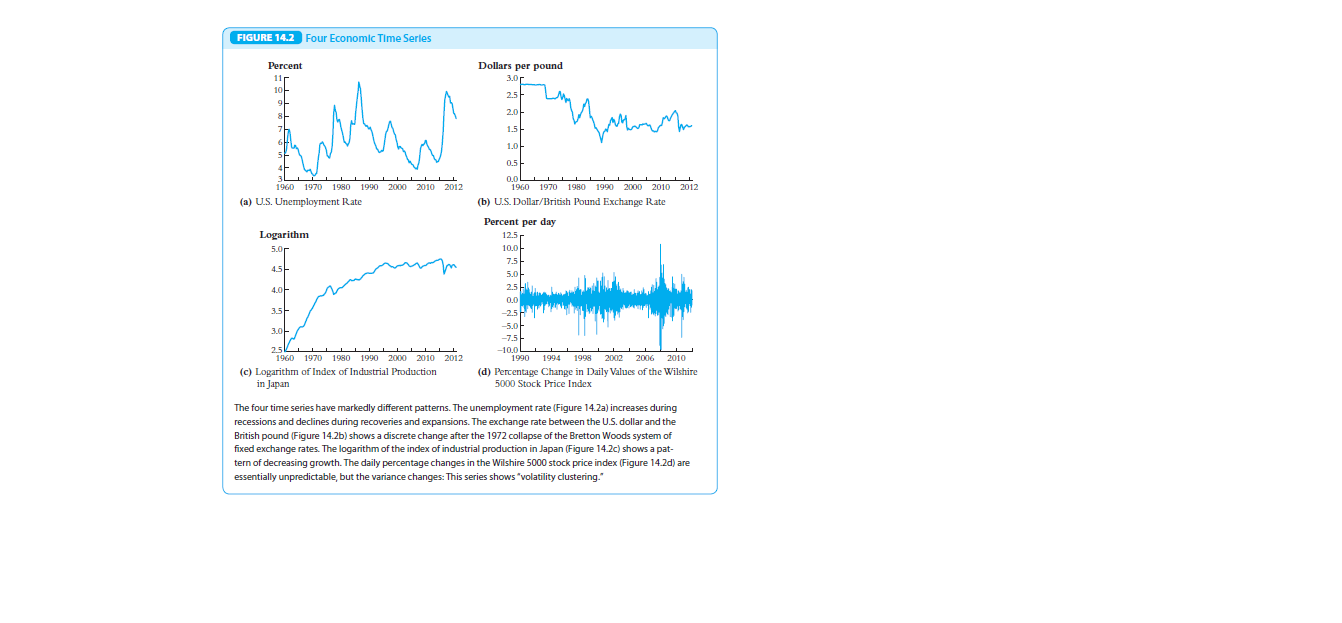
Look at the four plots in Figure 14.2—the US unemployment rate, the
dollar-pound exchange rate, the logarithm of the index of industrial production, and the percentage change in stock prices. Which of these series
appears to be non-stationary? Which of them appears to resemble a random
walk?
Transcribed Image Text:FIGURE 14.2 Four Economic Time Serles
Percent
Dollars per pound
11r
1아
3.0r
2.5
2.아
1.5-
1.0
0.5
-
0.0L
1960 1970 1980 1990 2000 2010 2012
1960 1970 1980 1990 2000 2010 2012
(a) U.S. Unemployment Rate
(b) U.S. Dollar/British Pound Exchange Rate
Percent per day
Logarithm
12.5
5.0r
10.0
7.5
4.5-
5.0
2.5
4.0-
0.0
3.5-
-2.5
-5.0
3.0-
-7.5
25
1960 1970 1980 1990 2000 2010 2012
-10.0
1990 1994
1998 2002
2006
2010
(c) Logarithm of Index of Industrial Production
in Japan
(d) Percentage Change in Daily Values of the Wilshire
5000 Stock Price Index
The four time series have markedly different patterns. The unemployment rate (Figure 14.2a) increases during
recessions and declines during recoveries and expansions. The exchange rate between the U.S. dollar and the
British pound (Figure 14.2b) shows a discrete change after the 1972 collapse of the Bretton Woods system of
fixed exchange rates. The logarithm of the index of industrial production in Japan (Figure 14.2c) shows a pat-
tern of decreasing growth. The daily percentage changes in the Wilshire 5000 stock price index (Figure 14.2d) are
essentially unpredictable, but the variance changes: This series shows "volatility clustering."
Expert Solution
This question has been solved!
Explore an expertly crafted, step-by-step solution for a thorough understanding of key concepts.

This is a popular solution!

Trending now
This is a popular solution!

Step by step
Solved in 2 steps

Knowledge Booster


Learn more about
Need a deep-dive on the concept behind this application? Look no further. Learn more about this topic, statistics and related others by exploring similar questions and additional content below.Recommended textbooks for you
MATLAB: An Introduction with Applications
Statistics
ISBN:
9781119256830
Author:
Amos Gilat
Publisher:
John Wiley & Sons Inc

Probability and Statistics for Engineering and th…
Statistics
ISBN:
9781305251809
Author:
Jay L. Devore
Publisher:
Cengage Learning

Statistics for The Behavioral Sciences (MindTap C…
Statistics
ISBN:
9781305504912
Author:
Frederick J Gravetter, Larry B. Wallnau
Publisher:
Cengage Learning
MATLAB: An Introduction with Applications
Statistics
ISBN:
9781119256830
Author:
Amos Gilat
Publisher:
John Wiley & Sons Inc
Probability and Statistics for Engineering and th…
Statistics
ISBN:
9781305251809
Author:
Jay L. Devore
Publisher:
Cengage Learning
Statistics for The Behavioral Sciences (MindTap C…
Statistics
ISBN:
9781305504912
Author:
Frederick J Gravetter, Larry B. Wallnau
Publisher:
Cengage Learning

Elementary Statistics: Picturing the World (7th E…
Statistics
ISBN:
9780134683416
Author:
Ron Larson, Betsy Farber
Publisher:
PEARSON

The Basic Practice of Statistics
Statistics
ISBN:
9781319042578
Author:
David S. Moore, William I. Notz, Michael A. Fligner
Publisher:
W. H. Freeman

Introduction to the Practice of Statistics
Statistics
ISBN:
9781319013387
Author:
David S. Moore, George P. McCabe, Bruce A. Craig
Publisher:
W. H. Freeman