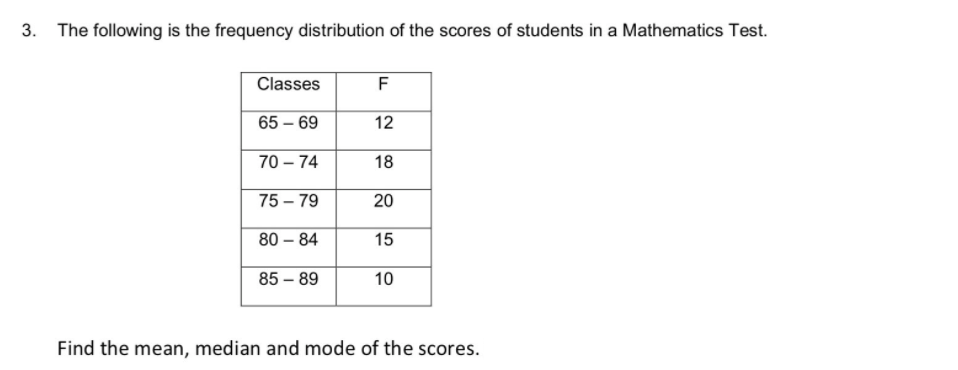
3. The following is the frequency distribution of the scores of students in a Mathematics Test. Classes F 65 – 69 12 70 – 74 18 75 – 79 20 80 – 84 85 – 89 10 Find the mean, median and mode of the scores. 15
Q: Find the (a) mean, (b) median, (c) mode, and (d) midrange for the data and then (e) answer the…
A:
Q: This data represent the age distribution of a sample of 100 people covered by health insurar…
A: data: Age ( classes) number (f) 25-34 23 35-44 29 45-54 28 55-64 20
Q: Find the mean for the following data set: 29 35 20 32 25 16 27 26.2 6.6 19
A: Ans#- Given data 29, 35, 29, 32, 25, 16 Find the mean
Q: Professor Z had the following grade distribution in her class:…
A: Data with regard to a single variable is called as univariate data.One of the measure is measure of…
Q: 6. For the population of scores shown in the frequency distribution table below, the mean is 1 4. 1
A:
Q: The following set of data shows the scores of 25 students in a 100-item test in Philosophy. 46 64 72…
A: The following set of data shows the scores of 25 students in a 100-item test in philosophy.…
Q: The following are final grades (in terms of percentages) from a class of 20 students. 70 75 70 84 90…
A: Given,sample size (n)=20mean(x¯)=∑i xin
Q: 4. Using the frequency distribution table below, what is the proportion of individuals that scored a…
A:
Q: What is the mean for the population of scores shown in the frequency distribution table? x Y 5…
A: From the provided data we have,
Q: The boxplot below shows the distribution of heights of 16 undergraduate statistics students. Using…
A: we have to interperete the boxplot
Q: Find the mean, median and mode of the given grouped data. Classes f 11-22 2…
A: Calculate Mean, Median, Mode from the following grouped data Class Frequency 11 - 22 2 23 -…
Q: Find the median from the following table : Marks No. of students Marks No. of students 0-10 2 40-50…
A:
Q: Find the median for the scores in the following frequency distribution table:
A:
Q: The following table gives the value (in billions of dollars) of the 10 most valuable teams in a…
A:
Q: Calculate the 41th percentile of the data shown 2.7 21.8 29.3 36 45.6 49.3 53.7 57.1 63.7 68.3…
A:
Q: The following are final grades (in terms of percentages) from a class of 20 students. 75 70 84 90 92…
A:
Q: 15c) Find the mode for the scores in the following frequency distribution table: Cumulative Number…
A:
Q: 12. Below is a data set for number of toys a child owns in a particular neighborhood: ABCDEFG|H…
A: toatal no. of child N=8total number of toyes ∑xi =2+4+4+3+2+3+2+4=24
Q: 22 Which of the following line plots displays data set where the mean, median and mode are all…
A: From the above picture, it's clearly showing that part b is symmetrically distributed where all…
Q: The following are distances travelled (in km) by 35 jeep drivers on a given day: 91 72 81 76 73 73…
A: The provided data are in ascending order…
Q: 2.) In which interval does the median of this data distribution occur? Heig hts of Black Cherry…
A: From the histogram, the frequency distribution table with cumulative frequency is- Interval…
Q: Oue. Students in a test were accarding to the frequency table given below: The marks obt Marks 23 24…
A: Given data are appropriate for measures of central tendency. Central tendency is used to find the…
Q: Here are the test scores for each of the eleven students. Complete the grouped frequency…
A:
Q: The following are final grades (in terms of percentages) from a class of 20 students. 70 75 70 84 90…
A: The mean of the data is,…
Q: a. Find the median of the sample and compare it to the mean and discuss the difference. b. Find the…
A:
Q: 2. Find the (a) mean, (b) median, (c) mode, and (d) mídrange for the data and then (e) answer the…
A: Note: Hey there! Thank you for the question. As per our policy, since you have posted a question…
Q: The table to the right shows selected ages of licensed drivers in one country and the corresponding…
A: Given data: The table shows the selected ages of licensed drivers and their corresponding…
Q: Find the mean, median, and mode of the data. Heights of Students in Class |||| || ||T 60 62 64 66 68…
A: From the given dot plot, the data values are 60, 64, 65, 65, 66, 67, 67, 67, 69, 69, 70, 72, 72, 74,…
Q: The table displays the scores of students on a recent exam. Find the mean of the scores to the…
A:
Q: The number of social interactions of ten minutes or longer over a one-week period for a group of…
A: Solution
Q: 6. The following data gives the distribution of marks scored by a set of students. Find the mean and…
A:
Q: Below is the frequency distribution table of the Mathematics test scores of 50 students. What…
A: Scores Frequency 46 -50 4 41-45 8 36-40 11 31-35 9 26-30 12 21-25 6
Q: The table displays the scores of students on a recent exam. Find the mean scores to the nearest…
A: objective is to find the mean.
Q: Find out the mean, median and mode of the following distribution : Marks Frequency Marks Frequency…
A:
Q: Exhibit 1 Stem-and-leaf of Data: Amount of Money earned in a day in dollars Leaf Unit = 10 N = * 59…
A: Before we answer b) (iv) and (v) let us convert the stem and leaf plot to original data. If we look…
Q: -of the data in a distribution is within 3 standa the mean? 66% 0% 50% 89%
A: Solution : According to the Chebyshev's theorem, (1-1/k^2) of the observation fall within k standard…
Q: The following data represent the annual rainfall distribution in Manila, Philippines, for a sample…
A: We enter the given data set in Excel sheet. Mean= ΣXifi/Σfi Use the above formula to calculate…
Q: Consider the following data. 0,-11,-11,-11, –9, 0,0 Step 2 of 3: Determine the median of the given…
A: Arrange the data values in the ascending order. -11, -11, -11, -9, 0, 0, 0 Here, number of values…
Q: 2. Find the mean, median, and mode of each set of data: a. 45 48 56 62 75 75 78 84 b. 3 48 56 62 75…
A: Since you have posted a question with multiple sub-parts, we will solve first three sub- parts for…
Q: (b): Following Data are Blood Lead Concentrations of Group of workers in a country Blood Leads 0 – 9…
A: Given the data as Blood Leads Frequency 0 - 9 15 20 - 29 21 30 - 39 39 40 - 49 54 50 -…
Q: 4. Find the mean, median, and mode for the scores in the following frequency distribution table: 8 1…
A: Mean: The mean is the sum of observations divided by the number of observations. that is,Mean = x =…
Q: s the ages of 36 executives. Find the percentile that corresponds to an age of 62 years old. 29 31…
A: Percentile formulae: Percentile = (Number of Values Below “x” / Total Number of Values) × 100
Q: What is the 60th percentile of the data?
A:
Q: For numbers 9 toll, use the grouped frequency distribution below. Class Interval Frequency 50-54 4…
A:
Q: Below are the typing speeds (words per minute) for 22 secretarial applicants of an international…
A:
Q: below are the numbers on the jerseys of the starting lineup for the New Orleans Saints when they won…
A: The given data is appropriate for measures of central tendency.
Q: Use the set of data in the box to answer the question. 1-3 100 123 100 121 139 100 119 117 125 136…
A: For the given data Find Mean =? mode =? median = ?
Q: 14. When a distribution is positively skewed, the relationship of the mean, median and mode from…
A: when a distribution is positively skewed, the relationship of the mean, median and mode is from left…
Q: Michael is taking a self-paced math class. His scores for each of the 20 quizzes during the academic…
A: Given data is80,71,88,85,77,89,73,87,87,86,85,75,72,84,89,73,81,68,86,75
Q: 10 The following table shows the frequency distribution of the number of children at a childcare…
A: As per our guidelines, we are allowed to answer three sub-parts : Given Data : Class Frequency…
Step by step
Solved in 2 steps with 2 images