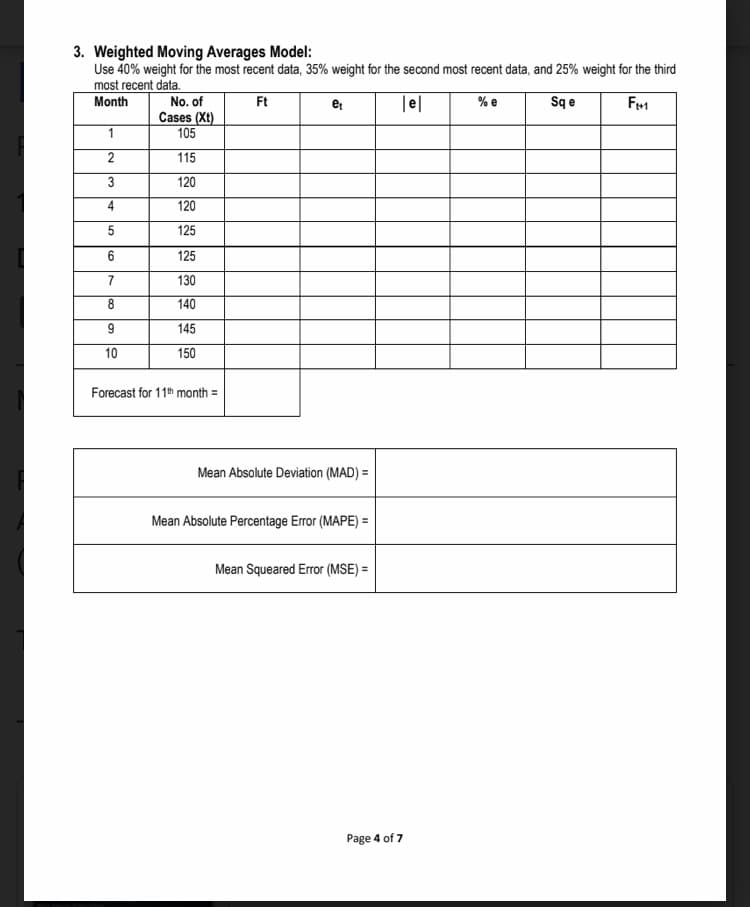
3. Weighted Moving Averages Model: Use 40% weight for the most recent data, 35% weight for the second most recent data, and 25% weight for the third most recent data. Month Ft |e| % e Sq e Ft+1 1 2 3 4 5 6 7 8 9 10 No. of Cases (Xt) 105 115 120 120 125 125 130 140 145 150 Forecast for 11th month= et


Q: A company concluded that maintenance costs of running the company was too high. Discuss at least 5…
A: Organizations have to bear the high cost of handling all the operations that are occurring daily.…
Q: Explain the link between innovation and organizational change. How does the Change Management Canvas…
A: Note -Hi! Thank you for the question As per the honour code, We’ll answer the first question since…
Q: You work as a secretary at Wayne General Motors. The Manager, Ms Dimba, recently discovered that…
A: A memorandum can be stated as the written message that is generally used in the professional…
Q: The monthly sales for Yazici Batteries, Inc., were as follows:…
A: A naive method is a forecasting approach in which the previous month's actual data is employed as…
Q: ts utilized to define IT project
A: Projects involving computer systems, databases, and related infrastructure are all considered IT…
Q: balanced scorecard approach
A: It is against the Bartleby Policy to attempt more than 1 Question, so I Will be solving the first…
Q: A make-to-order strategy produces products to customer specifications in large volumes.
A: Ans) Make to order strategy as the name suggests, make only when order is recieved. So when the…
Q: ITEM CATEGORY Paper Products Dishes, Glasses, and Silverware Cleaning Agent Cooking Oils and…
A:
Q: Examine the significance of project work breakdown structure and product work break down structure.
A: In the context of project management, work breakdown structure often called WBS can be stated as the…
Q: 3. a) Calculate the Lot size for Zara production clothes. Annual demand = 400,000 units D d Р Q = S…
A: a) From the above given information, The formula for production lot for the optimal number of…
Q: REQUIRED: d. Formulate and solve a spreadsheet model for this problem. 6. The Texago Corporation has…
A:
Q: Q-The company has kept at one of its plants 24 months records of the total number of failures…
A: Given data-
Q: A company produces three products A, B, C. • For manufacturing three raw materials P, Q and R are…
A: GIVEN:Profit Per Unit -A = Rs. 5B = Rs. 3C = Rs. 4Maximum raw material availability -P = 80 unitsQ =…
Q: Oya Optim, the business analyst, can invest up to $15,000 in stocks and loans. Each dollar invested…
A: Note: - As we can answer only up to three subparts we will answer the first three subparts here. If…
Q: PLEASE I ONLY NEED ANSWERS ON 7 AND 8
A: 2. Naïve methodThe naïve method is the simplest forecasting method and just predicts that the value…
Q: Tyler bakes Cookies (C) and Breads (B) with the help of two ovens in his little bakery. The time…
A: Given- Objective: Maximize Profit = 30×70 + 25×50 + 5×(C-70-25) + 4.5×(B-50-30)…
Q: QUESTION 4 Mega Inc. manufactures hairdryers for the commercial market. One of the crucial parts…
A: Given, Annual demand, d =60000 units Handling cost, h =RM 0.50 per unit per month = 12×0.50 =$6 per…
Q: Question 3 Regular output capacity is 130 units per month. Regular cost per unit = K600. Overtime…
A: Explanation: Level: If demand or forecast is greater than production, it goes backlog and satisfied…
Q: As a project manager appointed to lead a project in your organization Why is it so important to…
A: Whenever a risk event is identified and assessed, decisions are needed to be taken to how to cop up…
Q: Your company has just merged with a company in Dubai. What should you do to compensation to help…
A: 'Compensation management' is the domain for determining workers' apt pay & benefits. A vital…
Q: for the group to break even v
A: We need to calculate the time required for reaching the break even point to check if $22.50 is…
Q: An analysis of a laboratory activity resulted in the first table below. After this analysis, the…
A: TMU stands for Time Measuring Unit. In time and motion study, each motion is assigned with a…
Q: Management realized that the optimal product mix, taking setup costs into account, might be…
A: Objective Functions and Constraints: Based on the given details, the objective…
Q: The MAD for Method 1 = enter your response here thousand gallons (round your response to three…
A: Forecasting is a technique used to predict future outcomes on the basis of past data. In business…
Q: Explain which supply chain functions affect business success, and how?
A: Supply chain management:- The control of the flow of goods and services between businesses and…
Q: Smooth Chin Device Company The Smooth Chin Device Company is a manufacturer of high-end electric…
A: Find the Given details below:
Q: Q3
A: Diagrams & charts are visual presentations of data or information. They are helpful for…
Q: 17.5 A manufacturer of disk drives for notebook computers wants an MTBF of at least 50,000 hours.…
A: From the above given information, Total number of failures = 1+1+2 =4 A) Percentage of failures, p…
Q: Gold Mine Exploration: 1 - 10 years Gold mine exploration is challenging and complex. It requires…
A: Logistics management is a term used in operations management when the goods are shifted or moved…
Q: This exercise contains only parts b, c, and d. b) The critical activities for the leadership…
A: First we will draw the project network diagram. Initial activities are A, B, and C. After that we…
Q: what do you think is the importance of using linear programming in achieving the work individual…
A: Linear programming can be stated as the technique of advancing or optimizing different operations…
Q: Give a brief explanation of five major process scheduling policy factors.
A: Process scheduling:- The task of the process manager that deals with removing the active process…
Q: Following successor relationships are available for a project. Find the early start of activity E?…
A: The network diagram is of two types: AOA and AON AOA = arrow to arrow AON = arrow to node
Q: What is the correct formula to use to compare these options? Which options would be best for: I.…
A: Production is the process in which inputs are combined to have the required output. It includes a…
Q: Based on the activity time estimates, the expected times for each of the activities are (round…
A: A network diagram related to the project shows the sequence of the task that is performed to…
Q: What went wrong with the business?
A: When an enterprise started by 2 persons is incorporated into a company, the founders usually split…
Q: workplace something we should be concerned about?
A: Stress is a reaction to a situation – it isn't about the actual situation. When we believe that the…
Q: Productivity tends to decrease with the use of standardized because of the repetitive nature of the…
A: Ans) Standardization makes repetitive work. Worker do the work in same manner again and again. This…
Q: Ben Gibson, the purchasing manager at Coastal Products, was reviewing purchasing expenditures for…
A: A quotation can be stated as the document that a seller offers to the buyer to provide products and…
Q: Draw a Project Network and determine the critical path of this project? Activity Description…
A: Given data is
Q: Activity A B Ꭰ E F G H Crashed Activity Time 0.25 0.5 1 0.25 2 1 2 0.5 Cost ($) Normal Cras hing 750…
A: Activity Crashed activity time Normal cost Crashing cost A 0.25 750 1000 B 0.5 250 750 C 1 750…
Q: The management and oversight of scope modifications within the project has an impact on the…
A: Project scope is the component of project planning that concerns determining & documenting a…
Q: A bank operates from 10 a.m. to 8 p.m. and employs both full-time and part-time workers. Full-time…
A: 10-11 AM 11A-N N-1P 1P-2P 2P-3P 3P-4P 4P-5P 5P-6P 6P-7P 7P-8P 1 1 1 1 1 1 1 1 1 1…
Q: Warehousing activities play a significant role in an efficient distribution goods to the customer.…
A: Inventory management is described as a means of managing the stock of the business products and…
Q: Max has identified the need to make changes in the efficiency of his customer service department. In…
A: Organizational change can be stated as the process adopted by an organization or business to modify…
Q: What is KPI's & how it will be calculated? Q): What is EVA & how it will be calculated?
A: The term KPI stands for key performance indicators. They are a visual standards of the performance.…
Q: Quantum manufactures widgets in Johannesburg for distribution throughout South Africa. WP Widgets, a…
A:
Q: Consider a fixed period inventory model. The daily demand of the product has a mean of 30 and…
A: Given, Average daily demand, AVG =30 Standard deviation, STD =4 Orders are placed, r =18 days Lead…
Q: Which of the following steps for establishing a performance improvement plan involves seeking…
A: A performance improvement plan often called PIP also called as performance action plan can be stated…
Q: What is a portfolio in PM? explain how portfolio is managed in a project
A: Portfolio in the context of project management refer to grouping of programs and projects with an…
Weighted Moving Averages Model

Step by step
Solved in 3 steps with 5 images

- Suppose that a regional express delivery service company wants to estimate the cost of shipping a package (Y) as a function of cargo type, where cargo type includes the following possibilities: fragile, semifragile, and durable. Costs for 15 randomly chosen packages of approximately the same weight and same distance shipped, but of different cargo types, are provided in the file P13_16.xlsx. a. Estimate a regression equation using the given sample data, and interpret the estimated regression coefficients. b. According to the estimated regression equation, which cargo type is the most costly to ship? Which cargo type is the least costly to ship? c. How well does the estimated equation fit the given sample data? How might the fit be improved? d. Given the estimated regression equation, predict the cost of shipping a package with semifragile cargo.The file P13_22.xlsx contains total monthly U.S. retail sales data. While holding out the final six months of observations for validation purposes, use the method of moving averages with a carefully chosen span to forecast U.S. retail sales in the next year. Comment on the performance of your model. What makes this time series more challenging to forecast?The file P13_19.xlsx contains the weekly sales of a particular brand of paper towels at a supermarket for a one-year period. a. Using a span of 3, forecast the sales of this product for the next 10 weeks with the moving averages method. How well does this method with span 3 forecast the known observations in this series? b. Repeat part a with a span of 10. c. Which of these two spans appears to be more appropriate? Justify your choice.
- The file P13_02.xlsx contains five years of monthly data on sales (number of units sold) for a particular company. The company suspects that except for random noise, its sales are growing by a constant percentage each month and will continue to do so for at least the near future. a. Explain briefly whether the plot of the series visually supports the companys suspicion. b. By what percentage are sales increasing each month? c. What is the MAPE for the forecast model in part b? In words, what does it measure? Considering its magnitude, does the model seem to be doing a good job? d. In words, how does the model make forecasts for future months? Specifically, given the forecast value for the last month in the data set, what simple arithmetic could you use to obtain forecasts for the next few months?A small computer chip manufacturer wants to forecast monthly ozperating costs as a function of the number of units produced during a month. The company has collected the 16 months of data in the file P13_34.xlsx. a. Determine an equation that can be used to predict monthly production costs from units produced. Are there any outliers? b. How could the regression line obtained in part a be used to determine whether the company was efficient or inefficient during any particular month?The file P13_26.xlsx contains the monthly number of airline tickets sold by the CareFree Travel Agency. a. Create a time series chart of the data. Based on what you see, which of the exponential smoothing models do you think will provide the best forecasting model? Why? b. Use simple exponential smoothing to forecast these data, using a smoothing constant of 0.1. c. Repeat part b, but search for the smoothing constant that makes RMSE as small as possible. Does it make much of an improvement over the model in part b?
- The file P13_28.xlsx contains monthly retail sales of U.S. liquor stores. a. Is seasonality present in these data? If so, characterize the seasonality pattern. b. Use Winters method to forecast this series with smoothing constants = = 0.1 and = 0.3. Does the forecast series seem to track the seasonal pattern well? What are your forecasts for the next 12 months?The management of a technology company is trying to determine the variable that best explains the variation of employee salaries using a sample of 52 full-time employees; see the file P13_08.xlsx. Estimate simple linear regression equations to identify which of the following has the strongest linear relationship with annual salary: the employees gender, age, number of years of relevant work experience prior to employment at the company, number of years of employment at the company, or number of years of post secondary education. Provide support for your conclusion.The owner of a restaurant in Bloomington, Indiana, has recorded sales data for the past 19 years. He has also recorded data on potentially relevant variables. The data are listed in the file P13_17.xlsx. a. Estimate a simple regression equation involving annual sales (the dependent variable) and the size of the population residing within 10 miles of the restaurant (the explanatory variable). Interpret R-square for this regression. b. Add another explanatory variableannual advertising expendituresto the regression equation in part a. Estimate and interpret this expanded equation. How does the R-square value for this multiple regression equation compare to that of the simple regression equation estimated in part a? Explain any difference between the two R-square values. How can you use the adjusted R-squares for a comparison of the two equations? c. Add one more explanatory variable to the multiple regression equation estimated in part b. In particular, estimate and interpret the coefficients of a multiple regression equation that includes the previous years advertising expenditure. How does the inclusion of this third explanatory variable affect the R-square, compared to the corresponding values for the equation of part b? Explain any changes in this value. What does the adjusted R-square for the new equation tell you?
- Management of a home appliance store would like to understand the growth pattern of the monthly sales of Blu-ray disc players over the past two years. Managers have recorded the relevant data in the file P13_33.xlsx. a. Create a scatterplot for these data. Comment on the observed behavior of monthly sales at this store over time. b. Estimate an appropriate regression equation to explain the variation of monthly sales over the given time period. Interpret the estimated regression coefficients. c. Analyze the estimated equations residuals. Do they suggest that the regression equation is adequate? If not, return to part b and revise your equation. Continue to revise the equation until the results are satisfactory.An antique collector believes that the price received for a particular item increases with its age and with the number of bidders. The file P13_14.xlsx contains data on these three variables for 32 recently auctioned comparable items. Estimate a multiple regression equation using the given data. Interpret each of the estimated regression coefficients. Is the antique collector correct in believing that the price received for the item increases with its age and with the number of bidders? Interpret the standard error of estimate and the R-square value for these data.A trucking company wants to predict the yearly maintenance expense (Y) for a truck using the number of miles driven during the year (X1) and the age of the truck (X2, in years) at the beginning of the year. The company has gathered the data given in the file P13_13.xlsx. Note that each observation corresponds to a particular truck. Estimate a multiple regression equation using the given data. Interpret each of the estimated regression coefficients. Also, interpret the standard error of estimate and the R-square value for these data.