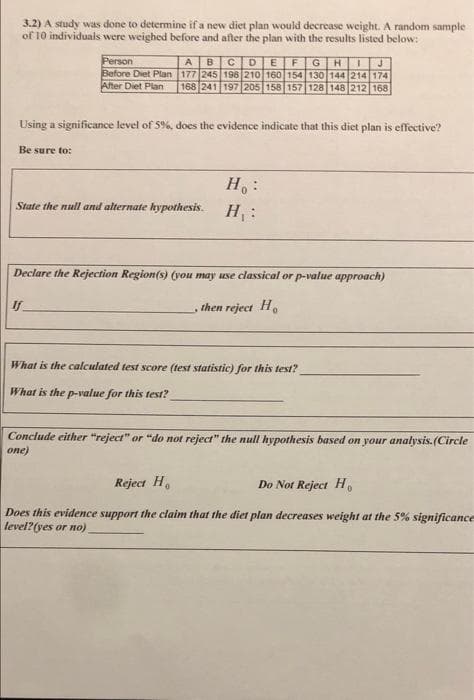
3.2) A study was done to determine if a new diet plan would decrease weight. A random sample of 10 individuals were weighed before and after the plan with the results listed below: Ferson BCDEFG Before Diet Plan 177 245198 210 160 154 130 144214 174 168 241 197 205 158 157 128 148 212 168 H IJ After Diet Plan Using a significance level of 5%%, does the evidence indicate that this diet plan is effective?


Q: A time series is a collection of data that Multiple Choice is limited to yearly data is limited to…
A: Given problem Given that A time series is a collection of data that Ans) records past…
Q: 4t mx(t) = 1- t?
A:
Q: Do the following as indicated: (Use the data below) 1. Report the assumption check and its…
A: 1. Assumptions, interpretation and tests: The assumptions of Multiple Regression Model are as…
Q: The amount of pollutants that are found in waterways near large cities is normally distributed with…
A: Let X denote the amount of pollutants that are found in waterways near large cities is normally…
Q: A coin-operated soda machine was designed to discharge, on the average, 7 ounces of beverage per…
A:
Q: The power density spectrum of a WSS process is Sw (ω) -4π δ(ω) + 3π δ(ω - 5π) + 3πδ(ω+5π) +2π δ(ω-…
A:
Q: A college math teacher claims that the mean score of students in his Statistics class is greater…
A: For the given data Perform Z test for one mean
Q: 1 Show that r in (6.16) is the square of the correlation (x - )(Vi – y) %3= as given by (6.18).
A: From the given information, y x y-y¯2 x-x¯2 x-x¯y-y¯ 78 4.4 47.16805 0.875722 6.426981 74…
Q: Q6. You joined a polling agency as a summer intern. You are helping them answer the following…
A: Given information: Given claim: Do a majority believe raising taxes will help the economy or is…
Q: An aircraft is used to fire at a target. It will be successful if 2 or more bombs hit the target. If…
A:
Q: Draw a comics strip on how to determine the appropriate tool when the variance is known, variance is…
A: The central limit theorem An essential component of the central limit theorem is that the…
Q: na study of cell phone usage and brain hemispheric dominance, an Internet survey was e-mailed to…
A:
Q: Consider the following data for a normal distribution: n = 68 x̅ = 75 σ = 8 Calculate the 99%…
A:
Q: 3. A survey on the drinking habits of Filipinos estimated the percentage of adults who drink beer…
A: Givensample size(n)=1516No. of adults said drank(x)=985p^=xn=9851516≅0.6497confidence interval = 95%
Q: installation of a new computer plug in station? After the plug in station was built, the librarian…
A: For the given data Perform t test for one sample mean
Q: The target thickness of aluminum sheets produced by a machine is 5 mm. A sample of 50 sheets is…
A: Given: Sample size,n=50Sample mean, x¯=0.46Sample sd. s=0.36α=0.05
Q: Calculate d¯d¯ and sdsd for the following set of paired data. Calculate each paired difference by…
A:
Q: A group of four IC chips consists of two good chips and two defective chips. The experiment consists…
A: here given there are total 4 chips of which 2 are defective and 2 are non defective
Q: The weights of grade 11 students are normally distributed with mean of 48 kgs and standard deviation…
A: Solution
Q: Trends in fashion have signaled the emergence of green as the color of the century. It ranked third…
A: Solution-: Given: p=9.24%=0.0924 The 95% C.I. is 0.0825 <p<0.1315 Does this data provide…
Q: a. Eric is meeting Alyssa's flight, which departed on time. What is the probability that Alyssa will…
A:
Q: 9. Find Lower quartile, Median, Upper quartile, 6th percentile, 4th quartile from the decile, 95th…
A:
Q: Consider the cellphone usage data in attached table. Test the claim that the average monthly expense…
A: Hello! As you have posted more than 3 sub parts, we are answering the first 3 sub-parts. In case…
Q: Based on this histogram, the numerical kurtosis value for average handle time is most likely
A:
Q: give a situation (real life situation) that best explain the given
A: Accuracy of an estimator refers to the closeness of a measure from the true value of the parameter.…
Q: The height (in feet) and trunk circumference (in inches) at breast height (4.5 feet above the…
A: The height (in feet) and trunk circumference (in inches) at breast height (4.5 feet above the…
Q: How many different ways are there for the 10 people to stand in line to buy movie tickets?
A: How many different ways are there for the 10 people to stand in line to buy movie tickets?
Q: Define the following concepts and where possible, give examples: (a) Formative assessment (b)…
A: We have to define Formative assessment Evaluation & Descriptive stastics
Q: An important issue in conservation biology is how dispersal among populations influences the…
A:
Q: Еxample 1. Let x1, X2, X3,..., Xn be a random sample drawn from a given population with mean µ and…
A:
Q: use combination or permutation At Heinz's Burger place, you can get a single, a double, or a triple…
A: Given that At Heinz's Burger place, you can get a single, a double, or a triple burger. You also…
Q: 1. What is the probability that out 393 confirmed cases 198 has recovered? a. 198/393 b. 50.38% 2.…
A: For the given Select the correct choice
Q: A travel agency is interested in finding out if different age groups frequent different Spring Break…
A: Chi-Square Analysis A chi-square statistic is a method for testing how well a model matches actual…
Q: A food company is planning to market a new flavor of ice cream. However, before marketing the…
A: Given X=112 n=400
Q: Population or Sample? A.) SJS Travel Agency, a nationwide local travel special rates on summer…
A: It is sample.
Q: 6.11 Show that r in (6.16) is the square of the correlation E (x; - )(y; -y)
A: From the given information, y x Y-Y¯2 X-X¯2 X-X¯Y-Y¯ 78 4.4 47.16805 0.875722 6.426981 74…
Q: Trends in fashion have signaled the emergence of green as the color of the century. It ranked third…
A: For the given data Find n =?
Q: hypothesis, and final conclusion that addresses the original claim. A number of years ago, Goku's…
A: Hypothesized population =9000 Sample mean = 9000 Sample standard deviation = 1000 sample size = 243…
Q: 3. Zcomputed 2.24 Zcritical = 2.33 %3D Decision: 4. Zcomputed = 0.16 Decision: %3D Zcritical = 2.17…
A: For the given values Determine the decision
Q: A store manager gathers some demographic information from the store's customers. The following chart…
A: Age Number of customers f/472 <20 56 0.1186 20-29 78 0.1653 30-39 75 0.1589 40-49 98…
Q: Given below are the ages of motorcyclists at the time they were fatally injured in traffic accidents…
A: Given below are the ages of motorcyclists at the time they were fatally injured in traffic…
Q: 1. Use Appendix A, Table III to determine the following probabilities for the standard normal random…
A: Given information- We have given a standard normal distribution. We have to find the following…
Q: Find the point estimate of the population parameter and the standard deviation for each of the…
A:
Q: The table presents 19 random counties in a certain state grouped according to the county's dominant…
A: Given that table presents 19 random counties in a certain state grouped according to the county's…
Q: we use sampling for all of the following except Reduced costs. Reduced field time. O decrease…
A: Decrease accuracy is the correct option.
Q: Problem Four: In a dental clinic with one dentist, the average number of patients from time to time…
A:
Q: 1. What is the probability that out 393 confirmed cases 198 has recovered? a. 198/393 b. 50.38% c.…
A: Note: As for the bartelby guidelines only three sub-parts can be answered. Kindly, repost with note…
Q: EXCERSISE Suppose that X1,.., X, form a random sample from a uniform distribution on the interval…
A: please see below
Q: 6.26 Use Theorem 6.6.5 to establish that, given a sample X1,.. ., Xn, thé are minimal sufficient.…
A: Given that -
Q: Find 95% confidence interval for the population mean of all the light bulbs produced by the…
A:

Step by step
Solved in 2 steps

- Weinstein, McDermott, and Roediger (2010) report that students who were given questions to be answered while studying new material had better scores when tested on the material compared to students who were simply given an opportunity to reread the material. In a similar study, a group of students from a large psychology class were given questions to be answered while studying for the final exam. The overall average for the exam was m = 73.4 but the n = 16 students who answered questions had a mean of M =78.3 with a standard deviation of s = 8.4. Use a two-tailed test with a = .01 to determine whether answering ques- tions while studying produced significantly higher exam scores.The manager of a company that assembles and exports a particular type of pumps wants to know if there is a link between the number of hours spent by assembly workers in training and their productivity on the job. A random sample of 7 assembly workers was selected and their performances evaluated. The summary of the obtained data is listed in Table 2. Table 2: Shows the time spend by workers during training and their productivity on jobTraining hours (x) 20 36 20 38 40 33 32Output (y) 40 70 44 56 60 48 62 (i) Construct a scatter plot of the sample data and comment on the relationship between hours of training and output. (ii) Estimate a simple regression line, using the method of least squares, to identify a linear relationship between the hours of training received by assembly workers and their output (i.e. number of units assembled per day). (iii) Interpret, in context, the gradient/slope of the regression line. (iv) Estimated the output at 20 hours training time. (v) Interpret the…Weinstein, McDermott, and Roediger (2010) report that students who were given questions to be answered while studying new material had better scores when tested on the material compared to students who were simply given an opportunity to reread the material. In a similar study, an instructor in a large psychology class gave one group of students questions to be answered while studying for the final exam. The overall average for the exam was μ = 73.4, but the n = 16 students who answered questions had a mean of M = 78.3 with a standard deviation of s = 8.4. For this study, did answering questions while studying produce significantly higher exam scores? Use a one-tailed test with α = .01 and the Distributions tool to help. (Round your answers to three decimal places, when needed.) sMM = t-critical = t = The results indicate: Failure to reject the null hypothesis; answering questions while studying did not produce significantly higher exam scores…
- Weinstein, McDermott, and Roediger (2010) report that students who were given questions to be answered while studying new material had better scores when tested on the material compared to students who were simply given an opportunity to reread the material. In a similar study, an instructor in a large psychology class gave one group of students questions to be answered while studying for the final exam. The overall average for the exam was μ = 73.4, but the n = 16 students who answered questions had a mean of M = 78.3 with a standard deviation of s = 8.4. For this study, did answering questions while studying produce significantly higher exam scores? Use a one-tailed test with α = .01A statistical program is recommended. Jensen Tire & Auto is in the process of deciding whether to purchase a maintenance contract for its new computer wheel alignment and balancing machine. Managers feel that maintenance expense should be related to usage, and they collected the following information on weekly usage (hours) and annual maintenance expense (in hundreds of dollars). Weekly Usage(hours) AnnualMaintenanceExpense 13 17.0 10 22.0 20 30.0 28 37.0 32 47.0 17 30.5 24 32.5 31 39.0 40 51.5 38 40.0 #1) Develop the estimated regression equation that could be used to predict the annual maintenance expense (in hundreds of dollars) given the weekly usage (in hours). (Round your numerical values to two decimal places.) #2) The expected expense of a machine being used 34 hours per week is $ hundred.3. Research suggests that depression significantly increases the risk of developing dementia later in life. Suppose that in a study involving 949 elderly persons, it was found that 22% of those who had depression went on to develop dementia, compared to only 17% of those who did not have depression. a) Describe the relevant population and the sample.b) Are the numbers 22% and 17% associated with the population or a sample?
- According to data published by a restaurant survey group, a sample of meals ordered had the distributions of proteins in the first row. According to vendors, restaurants claim that meals ordered had the distributions of proteins in the second row. Use a 0.05 significance level to test if the claimed distribution matches the sample.Protein Sampled (%) Claimed (%)Beef Chicken 41.7 26.845 26Pork Seafood8.7 13.7 10.1Plant 14 11 4The better-selling candies are often high in calories. Assume that the following data show the calorie content from samples of M&M's, Kit Kat, and Milky Way II. M&M's Kit Kat Milky Way II 250 245 200 230 225 228 220 205 202 210 215 190 250 240 180 Test for significant differences among the calorie content of these three candies. State the null and alternative hypotheses. -H0: MedianMM = MedianKK = MedianMWHa: MedianMM ≠ MedianKK ≠ MedianMW -H0: MedianMM = MedianKK = MedianMWHa: MedianMM > MedianKK > MedianMW -H0: MedianMM ≠ MedianKK ≠ MedianMWHa: MedianMM = MedianKK = MedianMW -H0: All populations of calories are identical.Ha: Not all populations of calories are identical. -H0: Not all populations of calories are identical.Ha: All populations of calories are identical. Find the value of the test statistic. (Round your answer to two decimal places.) Answer=?? Find the p-value. (Round your answer to three decimal places.) p-value =?? At a 0.05…Based on a survey of 12,344 U.S. college students and 6,729 Canadian college students, Kuo, Adlaf, Lee, Gliksman, Demers, and Wechsler (2002) report that alcohol use is more common among Canadian than U.S. students, but heavy drinking (five or more drinks in a row for males, four or more for females) is significantly higher among U.S. students than Canadian students. Is this an example of a survey research design?
- A corporation is trying to decide which of three makes of automobile to order for its fleet—domestic, Japanese, or European. Five cars of each type were ordered, and, after 10,000 miles of driving, the operating cost per mile of each was assessed. The accompanying results in cents per mile were obtained. Domestic Japanese European 18.0 20.1 19.3 15.6 15.6 15.4 15.4 16.1 15.1 19.1 15.3 18.6 16.9 15.4 16.1 a. Prepare the analysis of variance table for these data. b. Test the null hypothesis that the population mean operating costs per mile are the same for these three types of car. c. Compute the minimum significant difference and indicate which subgroups have different means.The better-selling candies are often high in calories. Assume that the following data show the calorie content from samples of M&M's, Kit Kat, and Milky Way candies. M&M's Kit Kat Milky Way 210 205 200 220 215 218 230 235 202 240 225 190 210 250 180 Test for significant differences among the calorie content of these three candies. State the null and alternative hypotheses. H0: MedianMM = MedianKK = MedianMWHa: MedianMM > MedianKK > MedianMW H0: All populations of calories are identical.Ha: Not all populations of calories are identical. H0: Not all populations of calories are identical.Ha: All populations of calories are identical. H0: MedianMM ≠ MedianKK ≠ MedianMWHa: MedianMM = MedianKK = MedianMW H0: MedianMM = MedianKK = MedianMWHa: MedianMM ≠ MedianKK ≠ MedianMW Find the value of the test statistic. (Round your answer to two decimal places.) =____ Find the p-value. (Round your answer to three decimal places.) p-value = _____ At a…5) A random sample of eight drivers insured with a company and having similar auto insurance policies was selected. The following table lists their driving experiences (in years) and monthly auto insurance premiums. Driving Experience (years) Monthly Auto Insurance Premium 5 $64 2 87 12 50 9 71 15 44 6 56 25 42 16 60 Does the insurance premium depend on the driving experience or does the driving experience depend on the insurance premium? Do you expect a positive or a negative relationship between these two variables?