3.Which graph shows a linear relationship? The frequency is linear when plotted as a function of inverse length (ff vs. 1/L1/L). The frequency is linear when plotted as a function of length (ff vs. LL). 4.Draw a best-fit line through the linear graph’s data, and use the slope of this line to determine the wave speed.
3.Which graph shows a linear relationship? The frequency is linear when plotted as a function of inverse length (ff vs. 1/L1/L). The frequency is linear when plotted as a function of length (ff vs. LL). 4.Draw a best-fit line through the linear graph’s data, and use the slope of this line to determine the wave speed.

University Physics Volume 1
18th Edition
ISBN:9781938168277
Author:William Moebs, Samuel J. Ling, Jeff Sanny
Publisher:William Moebs, Samuel J. Ling, Jeff Sanny
Chapter17: Sound
Section: Chapter Questions
Problem 105P: A string with a linear mass density of =0.0062 kg/m is stretched between two posts 1.30 m apart. The...

Related questions

Question
3.Which graph shows a linear relationship?
| The frequency is linear when plotted as a function of inverse length (ff vs. 1/L1/L). |
| The frequency is linear when plotted as a function of length (ff vs. LL). |
4.Draw a best-fit line through the linear graph’s data, and use the slope of this line to determine the wave speed.
Express your answer in meters per second to two significant figures.
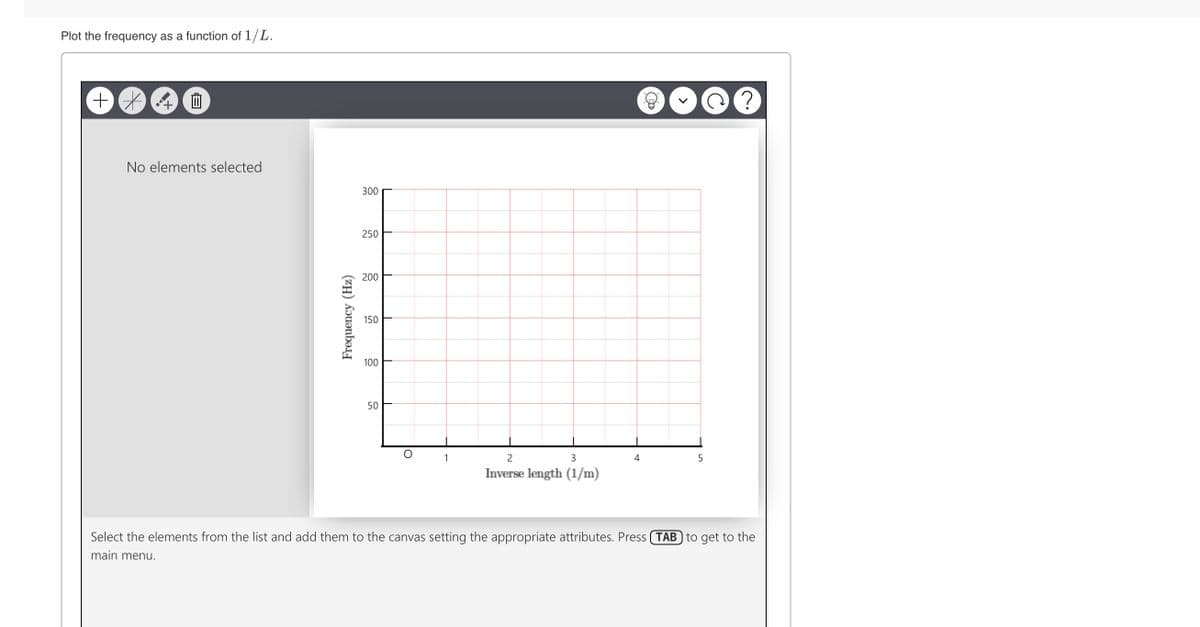
Transcribed Image Text:Plot the frequency as a function of 1/L.
No elements selected
300
250
200
150
100
50
1
3
4
5
Inverse length (1/m)
Select the elements from the list and add them to the canvas setting the appropriate attributes. Press (TAB to get to the
main menu.
Frequency (Hz)
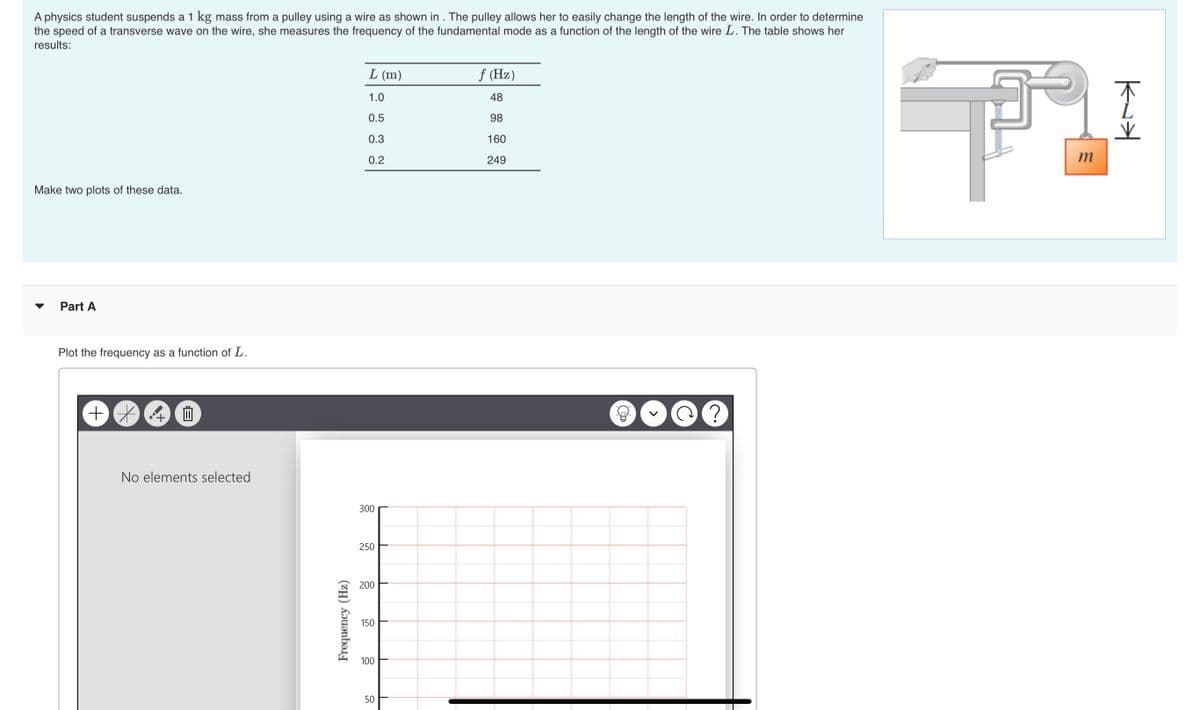
Transcribed Image Text:A physics student suspends a 1 kg mass from a pulley using a wire as shown in . The pulley allows her to easily change the length of the wire. In order to determine
the speed of a transverse wave on the wire, she measures the frequency of the fundamental mode as a function of the length of the wire L. The table shows her
results:
L (m)
f (Hz)
1.0
48
0.5
98
0.3
160
0.2
249
m
Make two plots of these data.
Part A
Plot the frequency as a function of L.
No elements selected
300
250
200
150
100
50
Frequency (Hz)
Expert Solution
This question has been solved!
Explore an expertly crafted, step-by-step solution for a thorough understanding of key concepts.

This is a popular solution!

Trending now
This is a popular solution!

Step by step
Solved in 2 steps with 2 images

Knowledge Booster


Learn more about
Need a deep-dive on the concept behind this application? Look no further. Learn more about this topic, physics and related others by exploring similar questions and additional content below.Recommended textbooks for you
University Physics Volume 1
Physics
ISBN:
9781938168277
Author:
William Moebs, Samuel J. Ling, Jeff Sanny
Publisher:
OpenStax - Rice University

Physics for Scientists and Engineers: Foundations…
Physics
ISBN:
9781133939146
Author:
Katz, Debora M.
Publisher:
Cengage Learning

Principles of Physics: A Calculus-Based Text
Physics
ISBN:
9781133104261
Author:
Raymond A. Serway, John W. Jewett
Publisher:
Cengage Learning
University Physics Volume 1
Physics
ISBN:
9781938168277
Author:
William Moebs, Samuel J. Ling, Jeff Sanny
Publisher:
OpenStax - Rice University
Physics for Scientists and Engineers: Foundations…
Physics
ISBN:
9781133939146
Author:
Katz, Debora M.
Publisher:
Cengage Learning
Principles of Physics: A Calculus-Based Text
Physics
ISBN:
9781133104261
Author:
Raymond A. Serway, John W. Jewett
Publisher:
Cengage Learning

Physics for Scientists and Engineers, Technology …
Physics
ISBN:
9781305116399
Author:
Raymond A. Serway, John W. Jewett
Publisher:
Cengage Learning