30 60 90 120 150 7.9 A. 3.1 Usa technology to find a logistic regression curve y- 9.4 9.7 9.9 approximating the given data. (Round b to 3 significant digits and A and N to 2 significant digits.) H 1+ Ab x Your answer cannot be understood or graded, More Information Draw a graph showing the data points and regression curve. y 12 12 10 10 41 21 25 50 75 100 125 150 20 40 60 100 125 130 12 12 10 10 41 21 25 50 75 100 125 150 50 75 100 125 150
30 60 90 120 150 7.9 A. 3.1 Usa technology to find a logistic regression curve y- 9.4 9.7 9.9 approximating the given data. (Round b to 3 significant digits and A and N to 2 significant digits.) H 1+ Ab x Your answer cannot be understood or graded, More Information Draw a graph showing the data points and regression curve. y 12 12 10 10 41 21 25 50 75 100 125 150 20 40 60 100 125 130 12 12 10 10 41 21 25 50 75 100 125 150 50 75 100 125 150

Functions and Change: A Modeling Approach to College Algebra (MindTap Course List)
6th Edition
ISBN:9781337111348
Author:Bruce Crauder, Benny Evans, Alan Noell
Publisher:Bruce Crauder, Benny Evans, Alan Noell
Chapter5: A Survey Of Other Common Functions
Section5.6: Higher-degree Polynomials And Rational Functions
Problem 1TU: The following fictitious table shows kryptonite price, in dollar per gram, t years after 2006. t=...

Related questions
Question
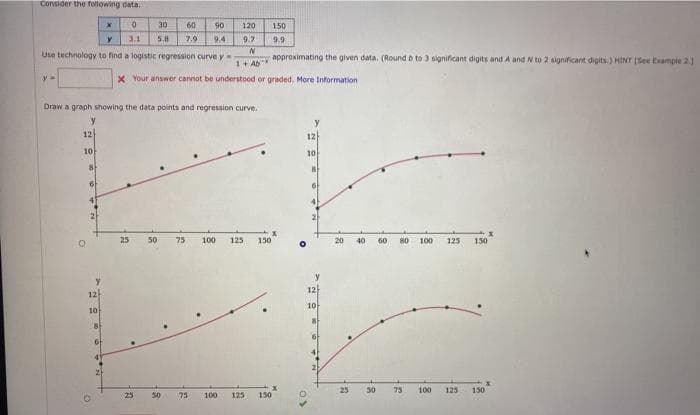
Transcribed Image Text:Consider the following data.
30
60
90
120
150
3.1
5.8
7.9
9.4
9.7
9.9
Usa technology to find a logistic regression curve y=
1+ Ab
approximating the given data. (Round o to 3 significant digits and A and N to 2 significant digits.) HINT (See Example 2.
y%3=
X Your answer cannot be understood or graded, More Information
Draw a graph showing the data points and regression curve.
y
12
12
10
10
25
50
75
100
125
150
20
40
60
80
100
125
150
y
12
12
10
10
6f
41
2
25
50
75
100
125
150
25
50
75
100
125
150
Expert Solution
This question has been solved!
Explore an expertly crafted, step-by-step solution for a thorough understanding of key concepts.

This is a popular solution!

Trending now
This is a popular solution!

Step by step
Solved in 3 steps with 2 images

Knowledge Booster


Learn more about
Need a deep-dive on the concept behind this application? Look no further. Learn more about this topic, statistics and related others by exploring similar questions and additional content below.Recommended textbooks for you
Functions and Change: A Modeling Approach to Coll…
Algebra
ISBN:
9781337111348
Author:
Bruce Crauder, Benny Evans, Alan Noell
Publisher:
Cengage Learning

Algebra & Trigonometry with Analytic Geometry
Algebra
ISBN:
9781133382119
Author:
Swokowski
Publisher:
Cengage

Functions and Change: A Modeling Approach to Coll…
Algebra
ISBN:
9781337111348
Author:
Bruce Crauder, Benny Evans, Alan Noell
Publisher:
Cengage Learning
Algebra & Trigonometry with Analytic Geometry
Algebra
ISBN:
9781133382119
Author:
Swokowski
Publisher:
Cengage