The population of a certain country from 1970 through 2010 is shown in the table x, Number of Years co the right. a. Use your graphing utility's exponential regression option to obtain a model of y, Population (millions) 208.7 after 1969 1 (1970) 11 (1980) 21 (1990) 31 (2000) 41 (2010) 240.5 the form y = ab* that fits the data. How well does the correlation coefficient, r, indicate that the model fits the data? b. Rewrite the model in terms of base e. By what percentage is the population increasing each year? 255.7 271.9 315.4 The model of the form y = ab* that fits the data is y = (Type integers or decimals rounded to three decimal places as needed.) How well does the model fit the data? Since the correlation coefficient is r ||, the model fits the data (Round to three decimal places as needed.) b. The model obtained in the previous step in terms of base e is y =e. (Type integers or decimals rounded to three decimal places as needed.) The population is increasing by approximately % each year. (Round to one decimal place as needed.)
The population of a certain country from 1970 through 2010 is shown in the table x, Number of Years co the right. a. Use your graphing utility's exponential regression option to obtain a model of y, Population (millions) 208.7 after 1969 1 (1970) 11 (1980) 21 (1990) 31 (2000) 41 (2010) 240.5 the form y = ab* that fits the data. How well does the correlation coefficient, r, indicate that the model fits the data? b. Rewrite the model in terms of base e. By what percentage is the population increasing each year? 255.7 271.9 315.4 The model of the form y = ab* that fits the data is y = (Type integers or decimals rounded to three decimal places as needed.) How well does the model fit the data? Since the correlation coefficient is r ||, the model fits the data (Round to three decimal places as needed.) b. The model obtained in the previous step in terms of base e is y =e. (Type integers or decimals rounded to three decimal places as needed.) The population is increasing by approximately % each year. (Round to one decimal place as needed.)

Functions and Change: A Modeling Approach to College Algebra (MindTap Course List)
6th Edition
ISBN:9781337111348
Author:Bruce Crauder, Benny Evans, Alan Noell
Publisher:Bruce Crauder, Benny Evans, Alan Noell
Chapter5: A Survey Of Other Common Functions
Section5.3: Modeling Data With Power Functions
Problem 3TU

Related questions

Concept explainers
Contingency Table
A contingency table can be defined as the visual representation of the relationship between two or more categorical variables that can be evaluated and registered. It is a categorical version of the scatterplot, which is used to investigate the linear relationship between two variables. A contingency table is indeed a type of frequency distribution table that displays two variables at the same time.
Binomial Distribution
Binomial is an algebraic expression of the sum or the difference of two terms. Before knowing about binomial distribution, we must know about the binomial theorem.
Topic Video
Question
Chapter 3 homework show work!!
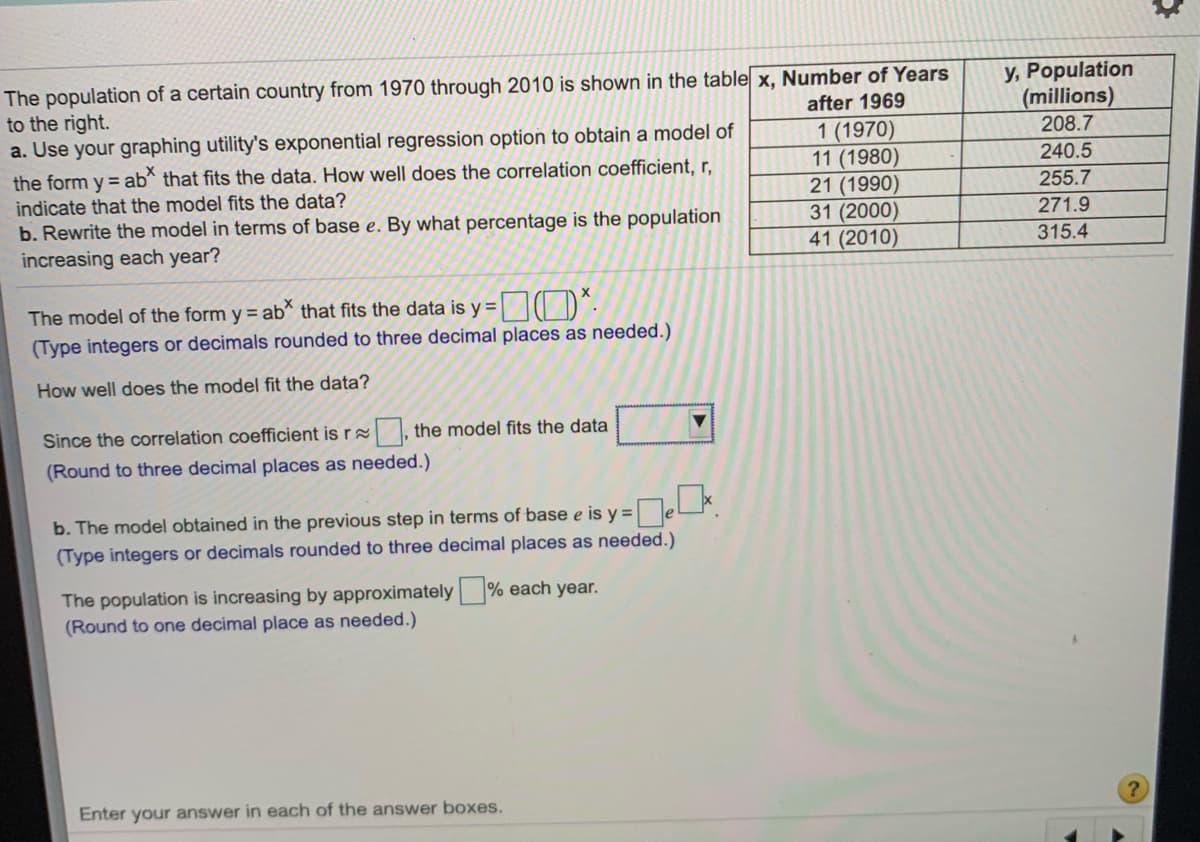
Transcribed Image Text:The population of a certain country from 1970 through 2010 is shown in the table x, Number of Years
to the right.
a. Use your graphing utility's exponential regression option to obtain a model of
y, Population
(millions)
208.7
240.5
after 1969
the form y = ab* that fits the data. How well does the correlation coefficient, r,
indicate that the model fits the data?
b. Rewrite the model in terms of base e. By what percentage is the population
increasing each year?
1 (1970)
11 (1980)
21 (1990)
31 (2000)
41 (2010)
255.7
271.9
315.4
The model of the form y = ab that fits the data is y = || D^-
(Type integers or decimals rounded to three decimal places as needed.)
How well does the model fit the data?
Since the correlation coefficient is r , the model fits the data
(Round to three decimal places as needed.)
b. The model obtained in the previous step in terms of base e is y =e.
(Type integers or decimals rounded to three decimal places as needed.)
The population is increasing by approximately % each year.
(Round to one decimal place as needed.)
Enter your answer in each of the answer boxes.
Expert Solution
This question has been solved!
Explore an expertly crafted, step-by-step solution for a thorough understanding of key concepts.

This is a popular solution!

Trending now
This is a popular solution!

Step by step
Solved in 3 steps

Knowledge Booster


Learn more about
Need a deep-dive on the concept behind this application? Look no further. Learn more about this topic, statistics and related others by exploring similar questions and additional content below.Recommended textbooks for you
Functions and Change: A Modeling Approach to Coll…
Algebra
ISBN:
9781337111348
Author:
Bruce Crauder, Benny Evans, Alan Noell
Publisher:
Cengage Learning

College Algebra
Algebra
ISBN:
9781305115545
Author:
James Stewart, Lothar Redlin, Saleem Watson
Publisher:
Cengage Learning

Functions and Change: A Modeling Approach to Coll…
Algebra
ISBN:
9781337111348
Author:
Bruce Crauder, Benny Evans, Alan Noell
Publisher:
Cengage Learning
College Algebra
Algebra
ISBN:
9781305115545
Author:
James Stewart, Lothar Redlin, Saleem Watson
Publisher:
Cengage Learning

Algebra & Trigonometry with Analytic Geometry
Algebra
ISBN:
9781133382119
Author:
Swokowski
Publisher:
Cengage