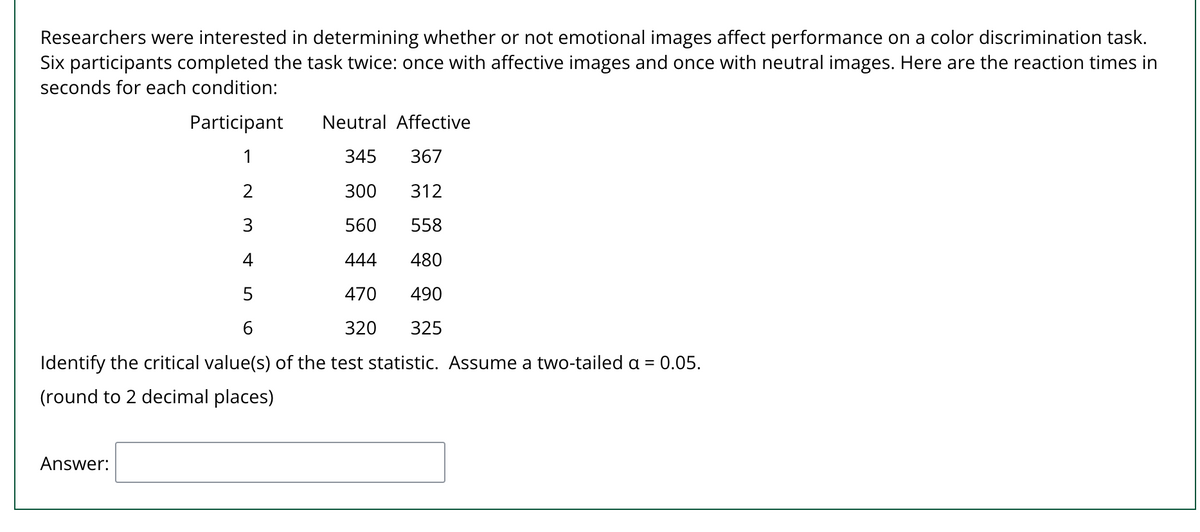
300 560 4 444 5 470 6 320 Identify the critical value(s) of the test statistic. Assume a two-tailed a = 0.05. (round to 2 decimal places) 2 3 Answer: 312 558 480 490 325


Q: can you please explain the details for the equation Pn = P0 (1+R)n
A:
Q: Patricia categorized her spending for this month into four categories: Rent, Food, Fun, and Other…
A: Given that Percentage of amount spend on Food = 24% Percentage of amount spend on…
Q: 2) A researcher is interested in studying if male smokers and female smokers smoke a different…
A: The test statistic in a research study is examined in this section information that is being used to…
Q: hypothesis testing if the null hypothesis is rejected, a. no conclusions can be drawn from the test…
A: We have given that, In hypothesis testing if the bull hypothesis is rejected? Then, We have to…
Q: A marketing manager conducted a study to determine the…
A:
Q: A sample of size 86 will be drawn from a population with mean 90 and standard deviation 24. Use the…
A: Solution:- from given information sample size n=86 mean μ=90Standard deviation σ=24
Q: In a random sample of four mobile devices, the mean repair cost was $85.00 and the standard…
A:
Q: A sample mean, sample standard deviation, and sample size are given. Use the one-mean t-test to…
A:
Q: Directions. Test the significance of the following correlation coefficients. 3. -0.58 4. 0.63…
A:
Q: Q8. Select the best response. A 95% confidence interval of a mean is -0.91 to 1.36. From this we can…
A: Given info: A 95% confidence interval of a mean is -0.91 to 1.36.
Q: Throughout the following questions, assume that is a statistical test of a null hypothesis Ho…
A: Given Information: ϕ is a statistical test at a null hypothesis H0against an alternative hypothesis…
Q: A brochure claims that the average maximum height a certain type of plant is 0.7 m. A gardener…
A: Given that Sample size=43 Sample mean=0.65 Population mean=0.7 Population standard deviation=0.2…
Q: a. Estimate the regression parameters and also write the prediction equation.
A: Followings are the Explanation of the Question
Q: The physical plant at the main campus of a large state university recieves daily requests to replace…
A: Empirical rule : According to empirical rule , 68% of data falls within the first standard…
Q: Statistics students in Oxnard College sampled 10 textbooks in the Condor bookstore and recorded the…
A:
Q: A regression was run to determine if there is a relationship between hours of TV watched per day (x)…
A: The following information has been given: x→hours of TV watched per day. y→number of sit ups a…
Q: Fill in the blanks: Write exact answers, except for the p-value. A company claims that each of their…
A:
Q: Suppose that f(x,y)= [15x²y ; 0<x<y<1 0; otherwise.
A:
Q: Each experiment compares three treatment conditions, and each experiment uses separate samples of n…
A: Given data Experiment A treatment 1 2 3 M=1 M=2 M=3 s=10…
Q: A standard deck of cards is being used to play a game. There are four suits (hearts, diamonds,…
A:
Q: A sample of size 50 will be drawn from a population with mean 12 and standard deviation 8. Use the…
A: The mean is 12 and the standard deviation is 8.
Q: Test Score 90 80 60 50 15 SCATTER PLOT A Scatterplot of Test Score vs Self Learning Time 25 30 Self…
A: I will answer the question in next step
Q: Suppose that historically, 36% of applicants that are offered admittance to Texas Tech actually…
A: Given : Proportion of applicants who offered admittance to Texas Tech actually enroll (p) = 0.36…
Q: A university surveyed recent graduates of the English department for their starting salaries. One…
A:
Q: a) A new machine is used to pack coffee powder. The mass of a packet follows a normal distribution…
A: The mean and standard deviation for the sample data are computed as follows:
Q: The Global Business Travel Association reported the domestic airfare for business travel for the…
A: Paired t test is used when sample sizes are equal and samples are paired i.e. not independent. This…
Q: 2. The null and alternative hypotheses For each pair of hypotheses that follows, decide whether Ho…
A: Given : 4 pair of hypothesis test :…
Q: The table below show data that has been collected from different fields from various farms in a…
A: General form of regression equation is as follows , y=b1x+b0 Where , y is dependent variable x…
Q: 1. Calculate the t-statistic for a test comparing the coefficient on X to a null hypothesis value of…
A: Ho: X=0 H1: X=/0 hence t=(x-X)/S.E.(x) =(0.9-0)/0.15 =6 t-statistic value=6
Q: 18. The mean lifetime of a wristwatch is 25 months, with a standard deviation of 5 months. If the…
A: Comment: As per the our company guidelines we are supposed to answer only one question. Kindly…
Q: Which is a continuous random variable? Y = "the arrival time of a school bus" X = "the number of…
A: We know that Discrete random variable: The random variable which takes only the value countable and…
Q: A simple random sample of size n is drawn from a population that is normally distributed. The sample…
A: It is given that Sample mean, x̄ = 109 Sample standard deviation, s = 10 Note: According to…
Q: The population mean and standard deviation are given below. Find the required probability and…
A: Given data: Sample size, n = 63 Population mean, μ=22 Population standard deviation, σ=1.29 Required…
Q: Statistical Inference for Difference in Population Proportions. Required data conditions [Mark one…
A: The basis for drawing statistical conclusions about the difference in proportions p^1-p^2 is the…
Q: (b) A random sample of enrollments from selected 6 business schools in London that specializes in…
A: Given data: Finance Marketing 574 892 477 913 601 843 498 1002 598 907 547 785
Q: A sample of size 190 will be drawn from a population with mean 45 and standard deviation 11. Use the…
A: Probability: Probability is the measurement of the probability that an event will occur in a Random…
Q: The five number summary of a dataset was found to be: 1, 6, 12, 15, 20 An observation is considered…
A: It is given that The five number summary of datasets Minimum value = 1 First quartile, Q1 = 6…
Q: Identify if the following statements is a proper interpretation of a 95% confidence interval.…
A: Confidence interval: Confidence intervals are constructed for population parameters based on the…
Q: 3. The following are the measurements of the height ten men. weight of 66 68 76 71 70 Height…
A: The question is about correlation Given : To find : a ) Correlation coefficient and to show it is…
Q: Q2. Adjusted R2 is the modified version of R after adjusting for the number of predictor variables…
A: The adjusted R2 helps to measure the relationship between two variables in the regression analysis.…
Q: The value of residual at y = 48 and x = 325 is = places)
A: Let x denote the number of pages. It is given that The regression equation of y on x is y = 35.3 +…
Q: Nolan hopes to determine the difference in the proportion of males and females who play video games…
A: Given, For Girls : sample size (n1) = 200 number of girls who played video games at least four days…
Q: Find the area of the shaded region. The graph depicts the standard normal distribution of bone…
A: Given information- We have given the graph depicts the standard normal distribution of bone density…
Q: The Office of Student Services at a large western state university maintains information on the…
A: Followings are the Explanation of the question
Q: 8. It is known that 25% of married women have high blood pressure. It is suspected that the…
A: Given information: H0:p=25%H1:p<25% Given that 20 women in the sample have high blood pressure…
Q: Let X₁, X2,...,Xn denote a random sample of size n taken from a distribution with probability…
A:
Q: Directions. Test the significance of the following correlation coefficients. 3. -0.58 4. 0.63 5.…
A: 3) The correlation coefficient is -0.58.
Q: Scores on a test are normally distributed with a mean of 78 and a standard deviation of 6. A student…
A: Given: Mean μ=78 Standard deviation σ=6 A student is selected at random.
Q: 3. A psychologist is studying the effects of lack of sleep on the performance of various…
A: The following information has been given: n=36x¯=1.82s=0.22
Q: 6. The following sample contains the scores of 6 students selected at random in Mathematics and…
A: The sample size n is 6.

Step by step
Solved in 2 steps

- In a study to determine if the nitrogen content of the soil in Wyoming is less than the nitrogen content of the soil in North Dakota, 27 independent random soil samples from Wyoming and 32 from North Dakota were taken. Given the testing statistics below, determine if the data provides sufficient evidence to conclude that the nitrogen content of the soil in Wyoming is less than the nitrogen content of the soil in North Dakota, at the 1% significance level. H0:μw≥μnHa:μw<μn The test statistic is t0=−1.53 t0.01=−2.663Three samples of each of three types of PVC pipe of equal wall thickness are tested to failure under three temperature conditions, yielding the results shown below. Research questions: Is mean burst strength affected by temperature and/or by pipe type? Is there a “best” brand of PVC pipe? Burst Strength of PVC Pipes (psi) Temperature PVC1 PVC2 PVC3 Hot (70º C) 247 299 239 277 287 262 283 275 279 Warm (40º C) 325 341 297 322 319 315 296 335 304 Cool (10º C) 358 375 327 366 352 334 338 359 340 Click here for the Excel Data File (a-1) Choose the correct row-effect hypotheses. a. H0: A1 ≠ A2 ≠ A3 ≠ 0 ⇐⇐ Temperature means differ H1: All the Aj are equal to zero ⇐⇐ Temperature means are the same b. H0: A1 = A2 = A3 = 0 ⇐⇐ Temperature means are the same H1: Not all the Aj are equal to zero ⇐⇐ Temperature means differ a b (a-2) Choose the correct column-effect hypotheses. a. H0: B1 ≠ B2 ≠ B3 ≠ 0 ⇐⇐…In a study to determine if the nitrogen content of the soil in Wyoming is significantly different from the nitrogen content of the soil in North Dakota, 34 independent random soil samples from Wyoming and 36 from North Dakota were taken. Given the testing statistics below, determine if the data provides sufficient evidence to conclude that the nitrogen content of the soil in Wyoming is significantly different from the nitrogen content of the soil in North Dakota, at the 1% significance level. H0:μw=μnHa:μw≠μn The test statistic is t0=2.653 t0.005=±2.382
- Suppose the National Transportation Safety Board (NTSB) wants to examine the safety of compact cars, midsize cars, and full-size cars. It collects a sample of three for each of the treatments (cars types). Using the hypothetical data provided below, test whether the mean pressure applied to the driver’s head during a crash test is equal for each types of car. Use α = 5%. Compact Midsize Full-size 643 655 702 680 672 469 427 525 495 483 484 465 402 476 435 State the null and alternate hypothesis for the data. Given the results, what will be the conclusion of the team?The table below gives beverage preferences for random samples of teens and adults. Beverage Teens Adults Total Coffee 50 200 250 Tea 100 150 250 Soft drink 200 200 400 Other 50 50 100 400 600 1,000 With a .05 level of significance, the critical value for the test is _____.A simple random sample of front-seat occupants involved in car crashes is obtained. Among3000occupants not wearing seat belts,36were killed. Among 7697occupants wearing seat belts,18were killed. Use a0.05significance level to test the claim that seat belts are effective in reducing fatalities. Complete parts (a) through (c) below.
- In a study conducted to investigate browsing activity by shoppers, each shopper was initially classified as a nonbrowser, light browser, or heavy browser. For each shopper, the study obtained a measure to determine how comfortable the shopper was in a store. Higher scores indicated greater comfort. Suppose the following data were collected. Light Heavy Nonbrowser Browser Browser 10 9 7 11 10 9 12 9 7 9 8 9 9 11 6 10 8 8 11 10 7 10 9 9 . Use to test for a difference among mean comfort scores for the three types of browsers. Compute the values identified below (to 2 decimals, if necessary). Sum of Squares, Treatment Sum of Squares, Error Mean Squares, Treatment Mean Squares, Error Calculate the value of the test statistic (to 2 decimals, if necessary). The -value is - Select your answer -less than .01between .01 and .025between .025 and .05between .05 and .10greater than .10Item 6 What is your…Three experiments investigating the relation between need for cognitive closure and persuasion were reported in “Motivated Resistance and Openness to Persuasion in the Presence or Absence of Prior Information,” by A. W. Kruglanski (Journal of Personality and Social Psychology, Vol. 65, No. 5, pp. 861–874). Part of the study involved administering a “need for closure scale” to a group of students enrolled in an introductory psychology course. The “need for closure scale” has scores ranging from 101 to 201. For the 73 students in the highest quartile of the distribution, the mean score was 178.70 . Assume a population standard deviation of 7.81. These students were all classified as high on their need for closure. Assume that the 73 students represent a random sample of all students who are classified as high on their need for closure. Find a 95% confidence interval for the population mean score on the “need for closure scale” for all students with a high need for closureIn one study of smokers who tried to quit smoking with nicotine path therapy,38 were smoking one year after the treatment, and 32 were not smoking one year after the treatment. Use a 0.10 significance level to test the claim that among smokers who try to quit with nicotine patch therapy, the majority are smoking a year after the treatment. d. Calculate the test statistic z. Which of these options is closest to z? A. negative 2.02 B. 0.72 C. negative 0.25 D. 2.59 e. Calculate the P-value. Which of these options is closest to the P-value? A. 0.2358 B. 0.2164 C. 0.3359 D. 0.2271 f. State the technical conclusion A. Reject Upper H 0 B. Do not reject Upper H 0 g. State the final conclusion A. There is sufficient evidence to warrant rejection of the claim. B. There is not sufficient evidence to warrant rejection of the claim.…
- A random sample of Engineering and Architecture students of a university were interviewed to determine if there is an association between study habits and academic performance. The results were tabulated below. Students Favourable Neutral Unfavourable Engineering 80 60 70 Architecture 100 50 70 Test the hypothesis that there is no significant difference between the study habits and academic performance using a 0.05 level of significance.Based on a survey of a random sample of 900 adults in the United States, a journalist reports that A random sample of 100 movie goers was asked to state his or her gender and favorite soft drink available at the local movie theater. The results appear in the table below. Is there a relationship between gender and soft drink preference? Coke Diet Coke Sprite Male 23 11 12 Female 16 28 10 To analyze the results, which of the following tests is most appropriate? A)Chi-square test of independence B)Chi-square test of homogeneity C)Two sample t-test D)Matched pair t-test E)Chi-square goodness of fit