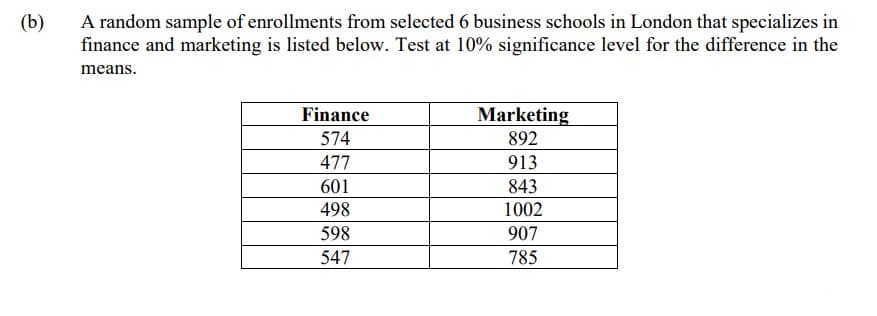
(b) A random sample of enrollments from selected 6 business schools in London that specializes in finance and marketing is listed below. Test at 10% significance level for the difference in the means. Finance 574 477 601 498 598 547 Marketing 892 913 843 1002 907 785


Q: A light bulb manufacturer wants to compare the mean lifetimes of two of its light bulbs, model A and…
A:
Q: OBSERVED Ran red-light Did not run red-light Is there evidence running red lights and speeding are…
A:
Q: In a test for the difference between two proportions, the sample sizes were n₁ = 99 and ₂ = 116 and…
A: Given that Sample sizes n1=99 , n2=116 Favorable cases x1=64 ,x2=56
Q: (i) (ii) (iii) X, has a pdf f(x₁) = { X₂ has a pdf f₂(x₂) =< x₂ 16 0 x₂²e-x₂²/2 4 0 X, and X₂ are…
A:
Q: Students A B C DEFG D Grade (x) 84 87 90 91 88 75 91 85 85 90 82 78 GWA (y) 1.75 2.00 3.00 2.75 2.75…
A: Given data, x y 84 1.75 87 2 90 3 91 2.75 88 2.75 75 1.25 91 2.5 85 2.25 85 2…
Q: The graph illustrates the distribution of test scores taken by College Algebra students. The maximum…
A: Given Information: Mean μ=78 Standard deviation σ=15 Maximum value is 140
Q: The test statistic of z = -3.32 is obtained when testing the claim that p<0.45. a. Using a…
A: From the provided information, The test statistic (z) = -3.32 The claim is that p < 0.45
Q: 3. A psychologist is studying the effects of lack of sleep on the performance of various…
A: The following information has been provided: x¯=1.82n=36s=0.22 The level of significance is:…
Q: Fill in the missing values in the contingency table. Round your expected frequencies to two or more…
A:
Q: The monthly utility bills in a city are normally distributed, with a mean of $100 and a standard…
A:
Q: Throughout the following questions, assume that is a statistical test of a null hypothesis Ho…
A: Given Information: ϕ is a statistical test at a null hypothesis H0against an alternative hypothesis…
Q: 13. A sample mean, sample standard deviation, and sample size are given. Use the one-mean t-test to…
A: Given dataSample mean(x¯) = 3.12 s = 0.59 n = 9 α = 0.01 H0: µ =…
Q: The smaller the distance between observed data points and the regression line, the smaller the sum…
A: Smaller SSR indicate better model. SSR used for measuring or determine the dispersion of data…
Q: a) A new machine is used to pack coffee powder. The mass of a packet follows a normal distribution…
A: The mean and standard deviation for the sample data are computed as follows:
Q: Experiment 1. Contacting 10 customers 2. Inspection of shipment of 100 laptops 3. Filling a bottle…
A: The objective is to supply the table with corresponding random variable and possible values of the…
Q: A city planner is researching why traffic speeds appear to be slower throughout the city. She checks…
A: Given that, Sample size is n= 51. We've to test that H0: u= 21.9 H1: u=! 21.9
Q: Single Americans In a recent year, about 22% of Americans 16 years and older are single. What…
A: It is given that n=210 and p=0.22.
Q: A 28-year-old man pays $200 for a one-year life insurance policy with coverage of $174787. If the…
A:
Q: A population has a mean μ = 88 and a standard deviation a=7. Find the mean and standard deviation of…
A: The mean is 88 and the standard deviation is 7.
Q: Let X~ binom (N = 80, p = 0.3). What is the standard deviation of p = X? Please enter your response…
A:
Q: Find the area of the shaded region. The graph depicts the standard normal distribution of bone…
A: Given information- We have given the graph depicts the standard normal distribution of bone density…
Q: Listed below are body temperatures from five different subjects measured at 8 AM and again at 12 AM.…
A: Mean is the measure of central tendency. It is calculated by adding all the values and divided by…
Q: Use the normal approximation to the binomial to find the probability for =n=50, p0.6, and =X36…
A: We have to use normal approximation to the binomial distribution First we will calculate mean and…
Q: e out those numbers for each month?
A: Advertisement Sales MARCH 900 56000 APRIL 2700 89000 MAY 3150 98500 JUNE 1300 54000 JULY…
Q: A sample is selected from a population with µ = 46, and a treatment is administered to the sample.…
A: Given that µ = 46,M = 48,s2 = 16 the value of Cohen’s d =?
Q: Q6. The outcome variable in a linear regression is best measured on which of the following scales?…
A: We have to find that which of the following scales outcome variable in a linear regression is best…
Q: Ques. 1 From following information find the correlation coefficient between advertisement expenses…
A: Hi! Thank you for the question, As per the honor code, we are allowed to answer one question at a…
Q: A study was done on smoking and lung capacity. 200 smokers took part in a study that asked them how…
A:
Q: 6. The following data resulted from an experiment to compare three burners, B₁, B₂ and B3. A Latin…
A: Given data: Engine 1 Engine 2 Engine 3 Day 1 B1 16 B2 17 B3 20 Day 2 B2 16 B3…
Q: Directions. Given the value of r, describe the relationship in terms of strength and direction. 1. r…
A: Since you have asked posted a question with multiple sub-parts, we will solve the first three…
Q: The physical plant at the main campus of a large state university recieves daily requests to replace…
A: Empirical rule : According to empirical rule , 68% of data falls within the first standard…
Q: that the researchers wanted estimate the mean reaction to withi Using the sample standar preliminary…
A: Given that Margin of error =E =5 Sample standard deviation =65
Q: Distinguish between the Population Regression Function (PRF) and the Sample Regression Function…
A: Solution: According to the guidelines if the multiple questions asked first question should be…
Q: The average hourly wage of workers at a fast food restaurant is $6.50 an hour with the standard…
A: Let X be the random variable from normal distribution with mean (μ) = $6.50 and standard deviation…
Q: A study was done on proctored and nonproctored tests. The results are shown in the table. Assume…
A: From the given information we have For Proctored Sample size (n1) = 32 Sample mean (x̅1) = 78.75…
Q: The number of calls that a call center gets in an hour is a Poisson random variable. The phone…
A:
Q: spurious correlations Examine the spurious correlation attached. Present findings that would…
A: Answer and explanation given in steps below.
Q: II. Supply the table with the corresponding random variable and/or the possible values of the random…
A: Experiment is the survey done by the researcher to understand the population. Random variable is the…
Q: Find the regression equation, letting the first variable be the predictor (x) variable. Using the…
A: Regression Equation: The Regression Equation is used to predict the response or dependent variable y…
Q: The Youth Risk Behavior Survey (a study of public high school…
A:
Q: The Climatologist that is working in the cave is trying to determine the age and growth rate of…
A: Given: Age, x Length in Micrometers, y 76 7906 87 9043 97 10091 104 10808 106 11024…
Q: The value of residual at y = 48 and x = 325 is = places)
A: Let x denote the number of pages. It is given that The regression equation of y on x is y = 35.3 +…
Q: 6) Test for a linear correlation between price and bedrooms in North Salinas.
A: Correlation: The statistical relationship between two variables is known as correlation.…
Q: Test Score 90 80 60 50 15 SCATTER PLOT A Scatterplot of Test Score vs Self Learning Time 25 30 Self…
A: I will answer the question in next step
Q: i) Find the matrix A-¹. ii) If Ax = y, solve for x.
A:
Q: An oceanographer claims that the mean dive duration of a North Atlantic right whale is 11.5 minutes.…
A: Given that Sample size n =35 Sample mean =12.4 Sample standard deviation =2.1
Q: What is the P VALUE? H(0) P= .68 H(A) P> .68 Sample size of 46. 63 People were surveyed. 48…
A: Given: X = 48 n = 63 P = 0.68 Formula Used: p-value = P(Z≥z) Z = p^-PP(1-P)n p^ = Xn
Q: You wish to test the following claim (Ha) at a significance level of a = 0.10. Ho:μ= 76.3 Hai μ <…
A:
Q: Find the equation of the regression line for the given data. Then construct a scatter plot of the…
A: Given data is x 1 1 2 4 4 5 y 38 45 52 47 65 67
Q: Estimate the output of the company in 1965. auk oda ni ogr Mooo nouris
A:

Step by step
Solved in 2 steps with 1 images

- What is meant by the sample space of an experiment?In a controlled laboratory experiment, scientists at the University of Minnesota discovered that 25% of a certain strain of rats subjected to a 20% coffee bean diet and then force-fed a powerful cancer-causing chemical later developed cancerous tumors. Would we have reason to believe that the proportion of rats developing tumors when subjected to this diet has increased if the experiment were repeated and 16 of 48 rats developed tumors? Use a 0.05 level of significance.Suppose that a random sample of firms with impaired assets was classified according to whether discretionary write-downs of these assets were taken, and also according to whether there was evidence of subsequent merger or acquisition activity. Using the data in the accompanying table, test the null hypothesis of no association between these characteristics. Write-Down Merger or Acquisition Activity? Yes No Yes 32 48 No 25 57
- In a simple random sample of 78 NCAA Division III Football games, the team that scored first won the game 52 times. Use a significance level of 0.05 to test the claim that the team that scores first wins the game three quarters of the time, in Division III NCAA football.In a study of brand recognition, 821 of the 849 subjects recognized the Campbell’s soup brand. Use this sample data to test the claim that the recognition rate is equal to 98%. Use a 0.10 level of significance.A study is made of residents in Phoenix and its suburbs concerning the proportion of residents who subscribe to Sporting News. A random sample of 90 urban residents showed that 12 subscribed, and a random sample of 97 suburban residents showed that 17 subscribed. Does this indicate that a higher proportion of suburban residents subscribe to Sporting News? Use a 1% level of significance
- In a study of cell phone use and brain hemispheric dominance, an internet survey was e-mailed to 5000 subjects randomly selected from an online group involved with ears. 717 surveys were returned. Use a 0.01 significance level to test the claim that the return rate is less than 15%.A study, which randomly surveyed 3,700 households and drew on this information from the IRS, found that 79% of households have conducted at least one IRA rollover from an employer-sponsored retirement plan. Suppose a recent random sample of 90 households in a certain county was taken and respondents were asked whether they had ever funded an IRA account with a rollover from an employer-sponsored retirement plan. Based on the sample data below, can you conclude at the 0.10 level of significance that the proportion of households in the county that have funded an IRA with a rollover is different from the proportion for all households reported in the study? 77 respondents said they had funded an account; 13 respondents said they had notA random sample of enrollments from medical schools that specialize in research and fromthose that are noted for primary care is listed. At a = 0.01 is there sufficient evidence toconclude that there is a difference in average enrollment based on the sample data? Research 474 783 813 692 884 577 605 467 670 443 565 694 277 663 414 696 419 783 546 442 662 605 427 474 371 587 293 555 527 728 107 277 320
- A random sample of 1100 potential voters was randomly divided into 2 groups. Group 1: 500 potential voters; no registration reminders sent; 248 registered to vote Group 2: 600 potential voters; registration reminders sent; 332 registered to vote Do these data support the claim that the proportion of voters who registered was greater in the group that received reminders than in the group that did not? Use a 1% level of significance.In a study, 28 adults with mild periodontal disease are assessed before and 6 months after implementation of a dental-education program intended to promote better oral hygiene. After 6 months, periodontal status improved in 15 patients, declined in 8, and remained the same in 5.9.1 Assess the impact of the program statistically (use a two-sided test).Suppose a researcher studied sleeping patterns in second-, fourth-, and sixth-grade children, and there were 7 students in each group, showing sleep periods in minutes below. Grade 2nd 4th 6th 580 525 562 570 575 532 594 497 565 543 478 537 552 517 525 506 455 493 537 532 490 Mean minutes participants slept 562.57 527.00 505.43 Suppose the researcher found significant ANOVA test result: the observed F statistic is 7.14 at alpha= .05 level, and the researcher made the decision to reject the null hypothesis. Finish up the ANOVA test with your interpretation in terms of the research question (you do not need to perform the test, just provide interpretation based the information available). Your interpretation: Given MSerror= 41, conduct the Tukey’s HSD post-hoc test to determine which groups differed significantly from one another. Include your calculation work, and show each comparison and state the outcome of each…