
Brief Principles of Macroeconomics (MindTap Course List)
8th Edition
ISBN:9781337091985
Author:N. Gregory Mankiw
Publisher:N. Gregory Mankiw
Chapter4: The Market Forces Of Supply And Demand
Section: Chapter Questions
Problem 8PA

Related questions
Question
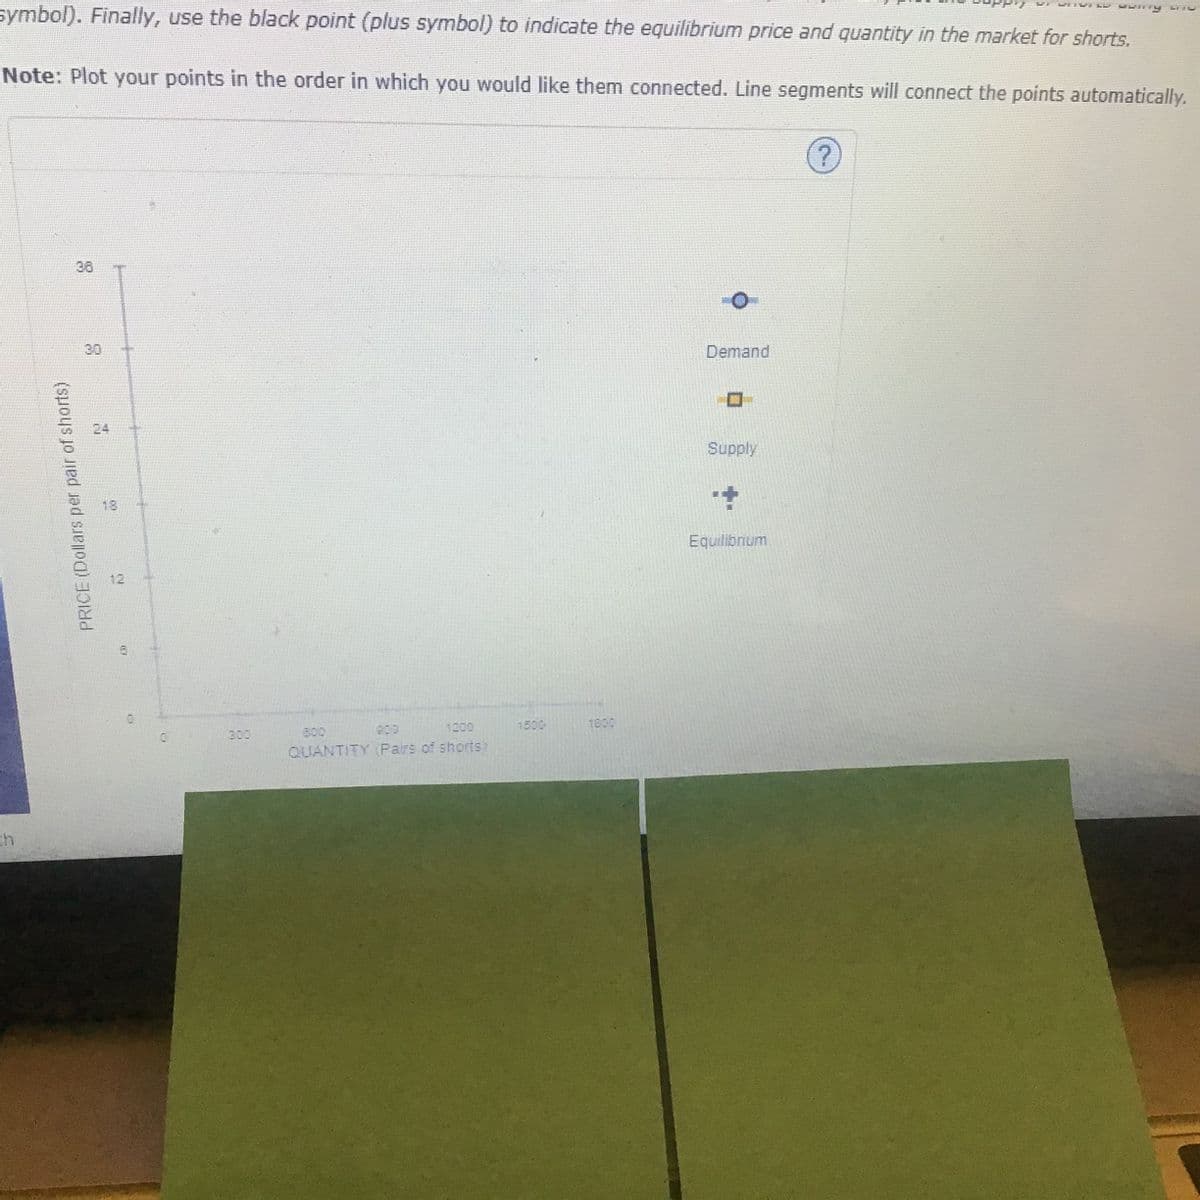
Transcribed Image Text:symbol). Finally, use the black point (plus symbol) to indicate the equilibrium price and quantity in the market for shorts.
Note: Plot your points in the order in which you would like them connected. Line segments will connect the points automatically.
36
30
Demand
24
Supply
18
Equilibrium
12
1200
1500
1800
300
B0O
a00
QUANTITY (Pairs of shorts
PRICE (Dollars per pair of shorts)
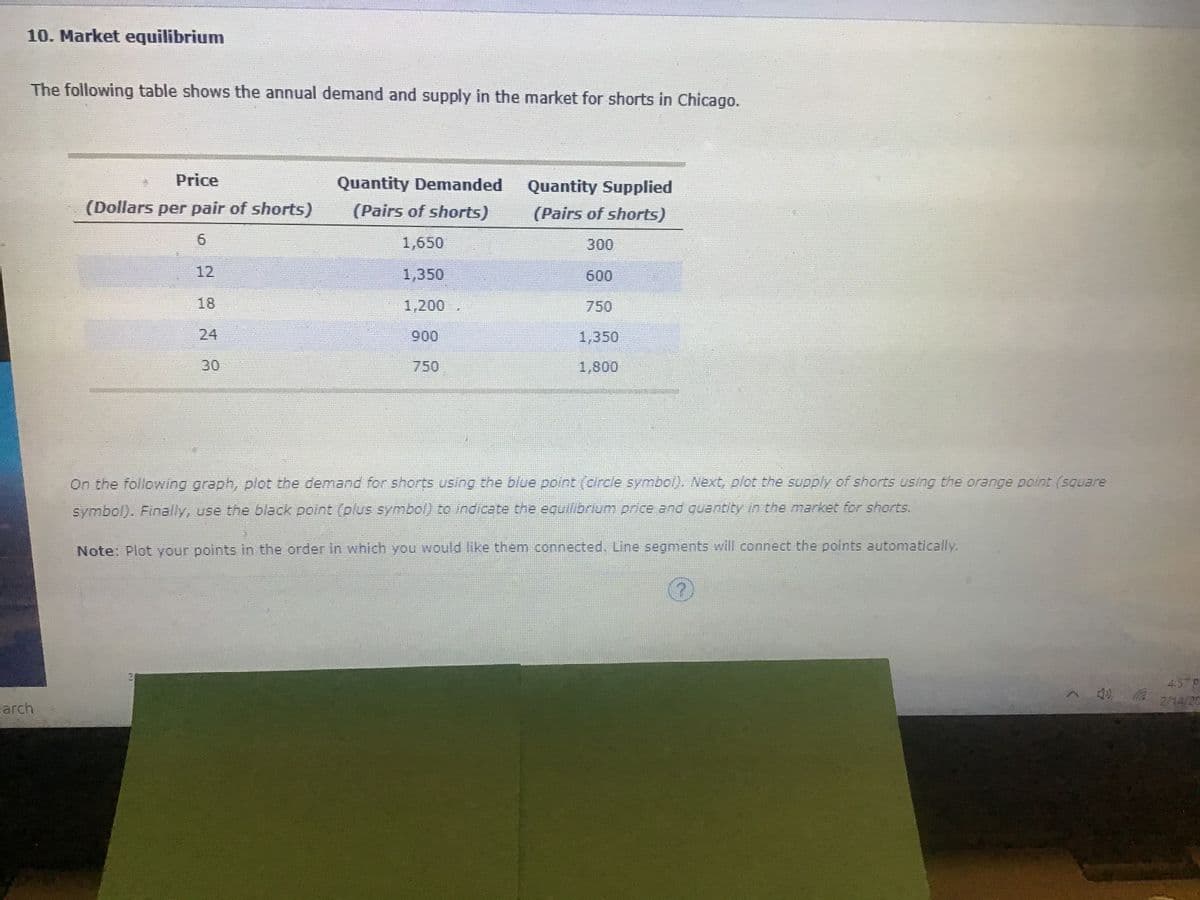
Transcribed Image Text:10. Market equilibrium
The following table shows the annual demand and supply in the market for shorts in Chicago.
Price
Quantity Demanded
Quantity Supplied
(Dollars per pair of shorts)
(Pairs of shorts)
(Pairs of shorts)
6.
1,650
300
12
1,350
600
18
1,200
750
24
900
1,350
30
750
1,800
On the following graph, plot the demand for shorts using the blue point (circle symbol). Next, plot the supply of shorts using the orange point (square
symbol). Finally, use the black point (plus symbol) to indicate the equilibrium price and guantity in the market for shorts.
Note: Plot your points in the order in which you would like them connected. Line segments will connect the points automatically.
4:57 P
2/14/20
earch
Expert Solution
Step 1
At Equilibrium Price, Quantity Demanded is equal to Quantity Supplied

Step by step
Solved in 3 steps with 1 images

Knowledge Booster


Learn more about
Need a deep-dive on the concept behind this application? Look no further. Learn more about this topic, economics and related others by exploring similar questions and additional content below.Recommended textbooks for you
Brief Principles of Macroeconomics (MindTap Cours…
Economics
ISBN:
9781337091985
Author:
N. Gregory Mankiw
Publisher:
Cengage Learning


Principles of Microeconomics
Economics
ISBN:
9781305156050
Author:
N. Gregory Mankiw
Publisher:
Cengage Learning
Brief Principles of Macroeconomics (MindTap Cours…
Economics
ISBN:
9781337091985
Author:
N. Gregory Mankiw
Publisher:
Cengage Learning
Principles of Microeconomics
Economics
ISBN:
9781305156050
Author:
N. Gregory Mankiw
Publisher:
Cengage Learning

Essentials of Economics (MindTap Course List)
Economics
ISBN:
9781337091992
Author:
N. Gregory Mankiw
Publisher:
Cengage Learning


Principles of Economics 2e
Economics
ISBN:
9781947172364
Author:
Steven A. Greenlaw; David Shapiro
Publisher:
OpenStax