1. Demand and supply in a market are described by the equations Q= 1800 + 240P Q= 3550 - 266P a) Solve algebraically to find equilibrium P and Q b) Draw the demand and supply curve and show equilibrium
1. Demand and supply in a market are described by the equations Q= 1800 + 240P Q= 3550 - 266P a) Solve algebraically to find equilibrium P and Q b) Draw the demand and supply curve and show equilibrium

Survey of Economics (MindTap Course List)
9th Edition
ISBN:9781305260948
Author:Irvin B. Tucker
Publisher:Irvin B. Tucker
Chapter4: Markets In Action
Section: Chapter Questions
Problem 18SQ

Related questions
Question
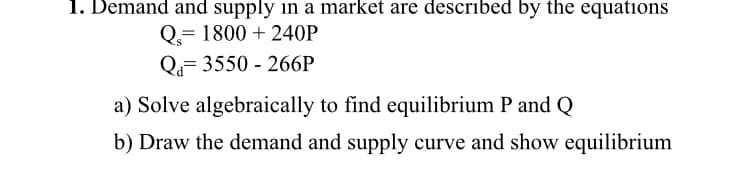
Transcribed Image Text:1. Demand and supply in a market are described by the equations
Q.= 1800 + 240P
Q= 3550 - 266P
a) Solve algebraically to find equilibrium P and Q
b) Draw the demand and supply curve and show equilibrium
Expert Solution
This question has been solved!
Explore an expertly crafted, step-by-step solution for a thorough understanding of key concepts.

This is a popular solution!

Trending now
This is a popular solution!

Step by step
Solved in 2 steps with 1 images

Knowledge Booster


Learn more about
Need a deep-dive on the concept behind this application? Look no further. Learn more about this topic, economics and related others by exploring similar questions and additional content below.Recommended textbooks for you
Survey of Economics (MindTap Course List)
Economics
ISBN:
9781305260948
Author:
Irvin B. Tucker
Publisher:
Cengage Learning


Survey of Economics (MindTap Course List)
Economics
ISBN:
9781305260948
Author:
Irvin B. Tucker
Publisher:
Cengage Learning


Managerial Economics: Applications, Strategies an…
Economics
ISBN:
9781305506381
Author:
James R. McGuigan, R. Charles Moyer, Frederick H.deB. Harris
Publisher:
Cengage Learning