38. Which of the following is(are) TRUE about the predicted model?* I. At 5% level of significance, there is sufficient evidence to say that weight is linearly dependent on at least one of the predictors in the model. II. The variation in the weight that is explained by length, width, and species type is 93.13% while the remaining percent is explained by other factors not considered in the model. O A. I only B. II only C. Both I and II OD. Neither I nor II
38. Which of the following is(are) TRUE about the predicted model?* I. At 5% level of significance, there is sufficient evidence to say that weight is linearly dependent on at least one of the predictors in the model. II. The variation in the weight that is explained by length, width, and species type is 93.13% while the remaining percent is explained by other factors not considered in the model. O A. I only B. II only C. Both I and II OD. Neither I nor II

MATLAB: An Introduction with Applications
6th Edition
ISBN:9781119256830
Author:Amos Gilat
Publisher:Amos Gilat
Chapter1: Starting With Matlab
Section: Chapter Questions
Problem 1P

Related questions
Question
38
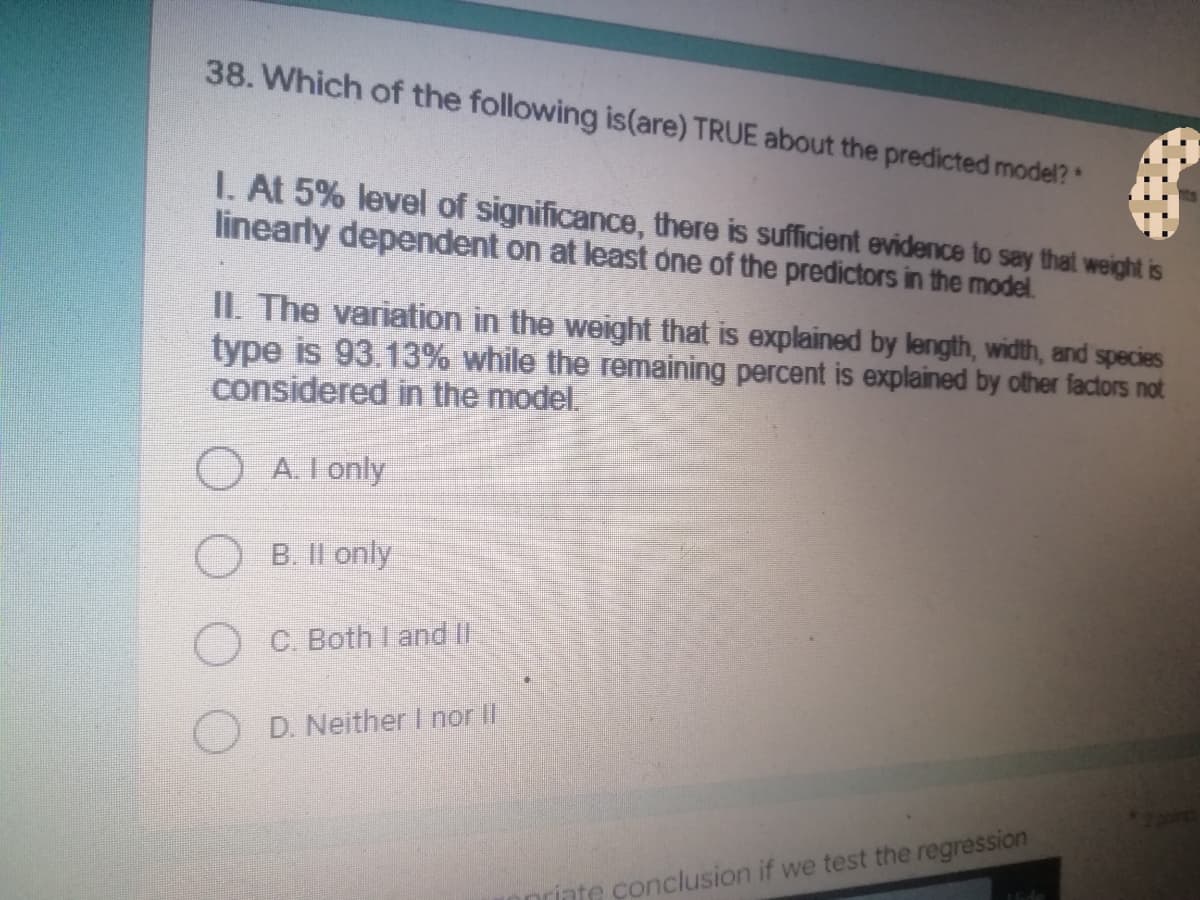
Transcribed Image Text:38. Which of the following is(are) TRUE about the predicted model? *
1. At 5% level of significance, there is sufficient evidence to say that weight is
linearly dependent on at least one of the predictors in the model.
II. The variation in the weight that is explained by length, width, and species
type is 93.13% while the remaining percent is explained by other factors not
considered in the model.
A. I only
B. II only
C. Both I and II
D. Neither I nor II
priate conclusion if we test the regression
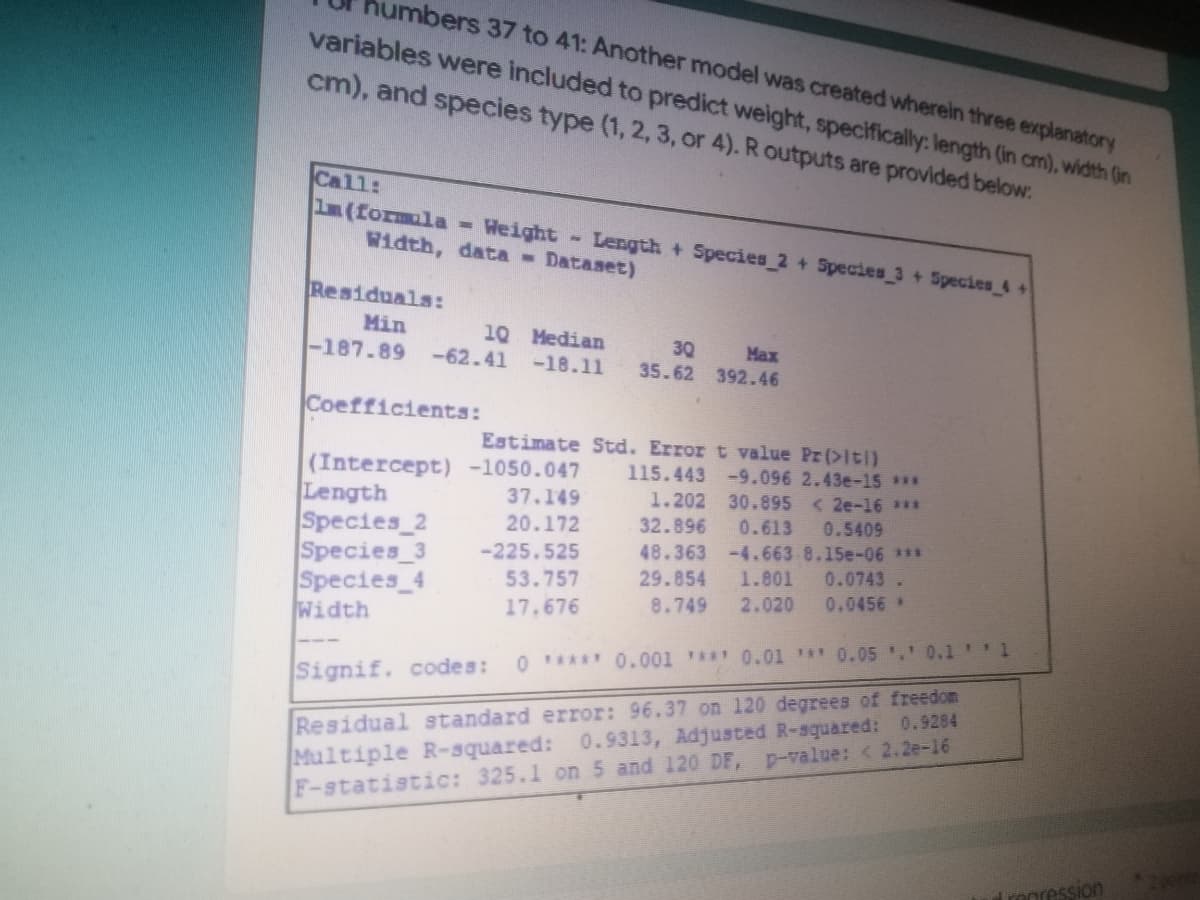
Transcribed Image Text:humbers 37 to 41: Another model was created wherein three explanatory
variables were included to predict weight, specifically: length (in cm), width (in
cm), and species type (1, 2, 3, or 4). R outputs are provided below:
Call:
im (formula = Weight-Length + Species 2 + Species 3+ Species 4+
Width, data Dataset)
Residuals:
Min
10 Median
30
-187.89 -62.41 -18.11
Max
35.62 392.46
Coefficients:
Estimate Std. Error t value Pr(>iti)
115.443 -9.096 2.43e-15 ***
(Intercept) -1050.047
Length
37.149
1.202 30.895 <2e-16 ***
20.172
32.896 0.613 0.5409
Species 2
Species_3 -225.525
53.757
48.363 -4.663 8.15e-06 ***
29.854 1.801 0.0743
0.0456 *
Species_4
Width
17.676
8.749 2.020
0 ***** 0.001 **** 0.01 *** 0.05 .' 0.1'' 1
Signif. codes:
Residual standard error: 96.37 on 120 degrees of freedom
Multiple R-squared: 0.9313, Adjusted R-squared: 0.9284
F-statistic: 325.1 on 5 and 120 DF, p-value: <2.2e-16
Tropression
Expert Solution
This question has been solved!
Explore an expertly crafted, step-by-step solution for a thorough understanding of key concepts.

Step by step
Solved in 2 steps with 1 images

Recommended textbooks for you
MATLAB: An Introduction with Applications
Statistics
ISBN:
9781119256830
Author:
Amos Gilat
Publisher:
John Wiley & Sons Inc

Probability and Statistics for Engineering and th…
Statistics
ISBN:
9781305251809
Author:
Jay L. Devore
Publisher:
Cengage Learning

Statistics for The Behavioral Sciences (MindTap C…
Statistics
ISBN:
9781305504912
Author:
Frederick J Gravetter, Larry B. Wallnau
Publisher:
Cengage Learning
MATLAB: An Introduction with Applications
Statistics
ISBN:
9781119256830
Author:
Amos Gilat
Publisher:
John Wiley & Sons Inc
Probability and Statistics for Engineering and th…
Statistics
ISBN:
9781305251809
Author:
Jay L. Devore
Publisher:
Cengage Learning
Statistics for The Behavioral Sciences (MindTap C…
Statistics
ISBN:
9781305504912
Author:
Frederick J Gravetter, Larry B. Wallnau
Publisher:
Cengage Learning

Elementary Statistics: Picturing the World (7th E…
Statistics
ISBN:
9780134683416
Author:
Ron Larson, Betsy Farber
Publisher:
PEARSON

The Basic Practice of Statistics
Statistics
ISBN:
9781319042578
Author:
David S. Moore, William I. Notz, Michael A. Fligner
Publisher:
W. H. Freeman

Introduction to the Practice of Statistics
Statistics
ISBN:
9781319013387
Author:
David S. Moore, George P. McCabe, Bruce A. Craig
Publisher:
W. H. Freeman