3876741091676 quany? Jump to level 1 In a poll of 1000 randomly selected voters ina local election, 272 voters were against school bond measures. What is the sample proportion ? Ex 0,123 E What is the margin of error m for the 95% confidence level? Ex 0.123
3876741091676 quany? Jump to level 1 In a poll of 1000 randomly selected voters ina local election, 272 voters were against school bond measures. What is the sample proportion ? Ex 0,123 E What is the margin of error m for the 95% confidence level? Ex 0.123

MATLAB: An Introduction with Applications
6th Edition
ISBN:9781119256830
Author:Amos Gilat
Publisher:Amos Gilat
Chapter1: Starting With Matlab
Section: Chapter Questions
Problem 1P

Related questions
Question
100%
Transcribed Image Text:zy Section 7.2- MAT 240. X
Ö https://learn.zybooks.com/zybook/MAT-240-J4373-OL-TRAD-UG.22EW4/chapter/7/section/2?content_resource id=5. A Q
My library > MAT 240: Applied Statistics home > 7.2 Confidence intervals for population proportions
E zyBooks catalog
Help/FAQ
e Lashon
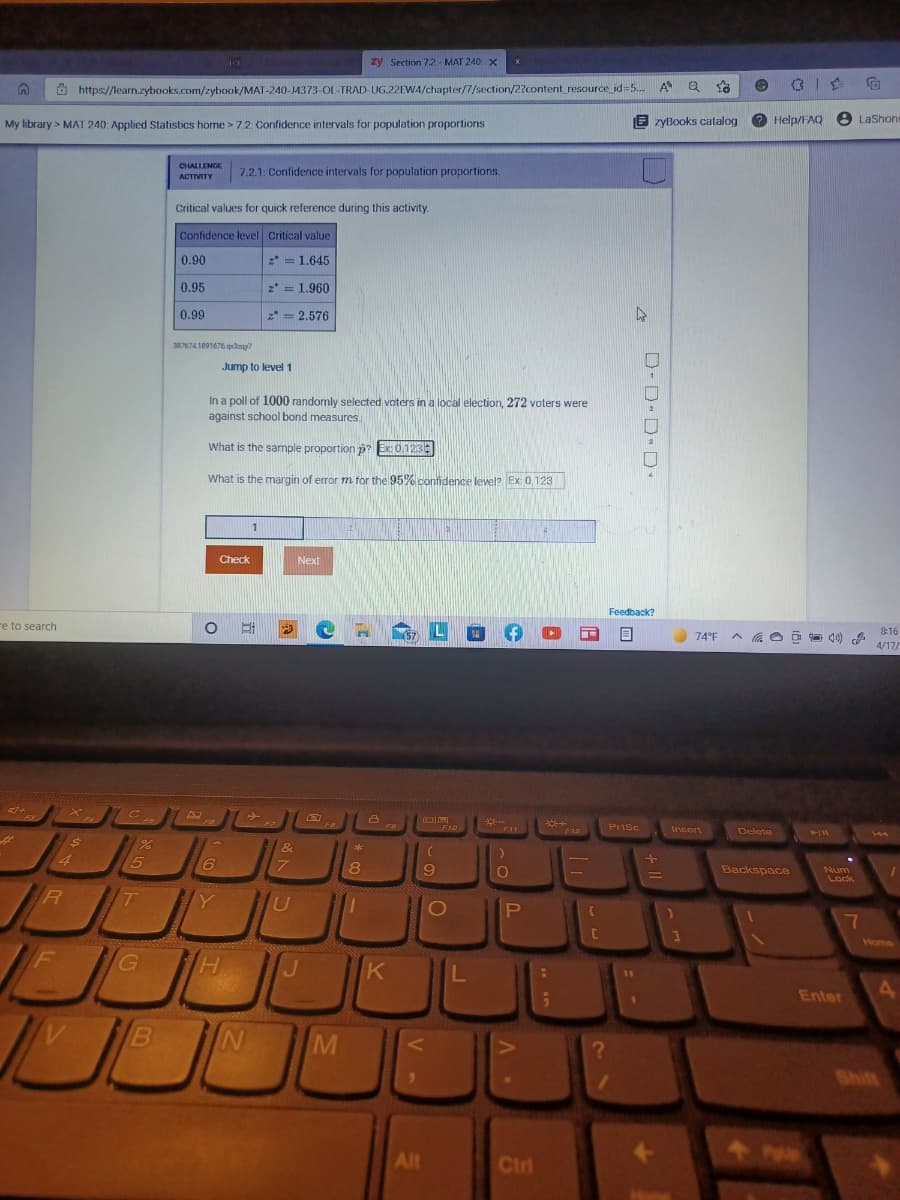
CHALLENGE
7.2.1: Confidence intervals for population proportions.
ACTIVITY
Critical values for quick reference during this activity.
Confidence level Critical value
0.90
2* = 1.645
0.95
2* =
1.960
0.99
* = 2.576
3876741891676 qdany
Jump to level 1
In a poll of 1000 randomly selected voters in a local election, 272 voters were
against school bond measures.
What is the sample proportion p?Ex 0,123
What is the margin of error m for the 95% confdence level? Ex 0.123
1
21
Check
Next
Feedback?
re to search
8:16
(57
74°F
4/17/
F7
F10
*F12
Prisc
Insort
F11
Delete
&
4
7.
8
9
Backspace
Num
Lock
Y
P
C
Home
HI
Enter
M
Shift
Alt
Ctrl
D-D D D
Expert Solution
This question has been solved!
Explore an expertly crafted, step-by-step solution for a thorough understanding of key concepts.

Step by step
Solved in 2 steps with 1 images

Recommended textbooks for you
MATLAB: An Introduction with Applications
Statistics
ISBN:
9781119256830
Author:
Amos Gilat
Publisher:
John Wiley & Sons Inc

Probability and Statistics for Engineering and th…
Statistics
ISBN:
9781305251809
Author:
Jay L. Devore
Publisher:
Cengage Learning

Statistics for The Behavioral Sciences (MindTap C…
Statistics
ISBN:
9781305504912
Author:
Frederick J Gravetter, Larry B. Wallnau
Publisher:
Cengage Learning
MATLAB: An Introduction with Applications
Statistics
ISBN:
9781119256830
Author:
Amos Gilat
Publisher:
John Wiley & Sons Inc
Probability and Statistics for Engineering and th…
Statistics
ISBN:
9781305251809
Author:
Jay L. Devore
Publisher:
Cengage Learning
Statistics for The Behavioral Sciences (MindTap C…
Statistics
ISBN:
9781305504912
Author:
Frederick J Gravetter, Larry B. Wallnau
Publisher:
Cengage Learning

Elementary Statistics: Picturing the World (7th E…
Statistics
ISBN:
9780134683416
Author:
Ron Larson, Betsy Farber
Publisher:
PEARSON

The Basic Practice of Statistics
Statistics
ISBN:
9781319042578
Author:
David S. Moore, William I. Notz, Michael A. Fligner
Publisher:
W. H. Freeman

Introduction to the Practice of Statistics
Statistics
ISBN:
9781319013387
Author:
David S. Moore, George P. McCabe, Bruce A. Craig
Publisher:
W. H. Freeman