Consider the following time series data. Week 1 2 3 45 6 Value 18 11 13 10 17 12 (a) Construct a time series plot. miWW 20 20 20 20 18 18 18 18 16 16 16 14 14 14 12 12 12 10 10 10 8 8. 8. 6. 4. 41 21 2 2 2 0- 0- 0- 1 2 4 5 6 7 1 4 5 7 1 3 4 6 1 4 6. Week Week Week Week What type of pattern exists in the data? O The data appear to follow a seasonal pattern. O The data appear to follow a cyclical pattern. O The data appear to follow a trend pattern. O The data appear to follow a horizontal pattern. (b) Develop the three-week moving average forecasts for this time series. (Round your answers to two decimal places.) Time Series Value Week Forecast 1 18 11 3 13 4 10 17 12 Compute MSE. (Round your answer to two decimal places.) MSE = What is the forecast for week 7?
Consider the following time series data. Week 1 2 3 45 6 Value 18 11 13 10 17 12 (a) Construct a time series plot. miWW 20 20 20 20 18 18 18 18 16 16 16 14 14 14 12 12 12 10 10 10 8 8. 8. 6. 4. 41 21 2 2 2 0- 0- 0- 1 2 4 5 6 7 1 4 5 7 1 3 4 6 1 4 6. Week Week Week Week What type of pattern exists in the data? O The data appear to follow a seasonal pattern. O The data appear to follow a cyclical pattern. O The data appear to follow a trend pattern. O The data appear to follow a horizontal pattern. (b) Develop the three-week moving average forecasts for this time series. (Round your answers to two decimal places.) Time Series Value Week Forecast 1 18 11 3 13 4 10 17 12 Compute MSE. (Round your answer to two decimal places.) MSE = What is the forecast for week 7?

MATLAB: An Introduction with Applications
6th Edition
ISBN:9781119256830
Author:Amos Gilat
Publisher:Amos Gilat
Chapter1: Starting With Matlab
Section: Chapter Questions
Problem 1P

Related questions
Question
Please solve all part otherwise I will u unhelpful
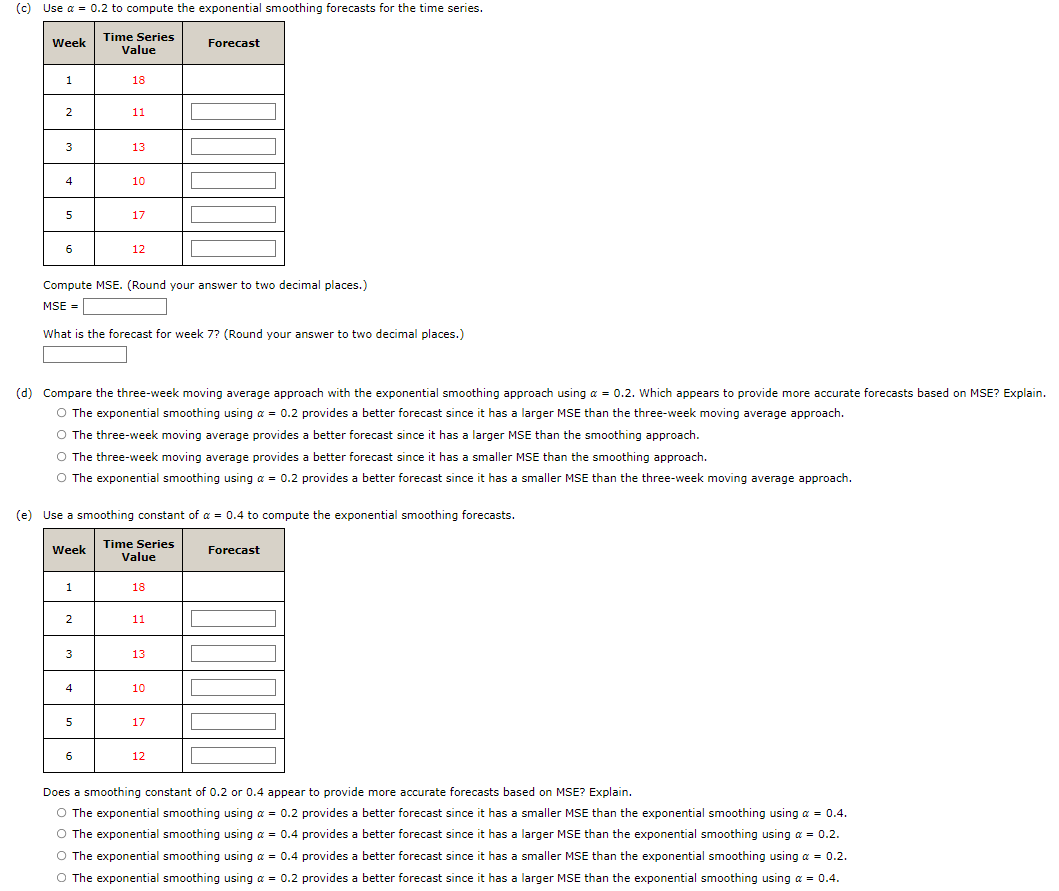
Transcribed Image Text:(c) Use a = 0.2 to compute the exponential smoothing forecasts for the time series.
Time Series
Week
Forecast
Value
18
2
11
3
13
4
10
5
17
6
12
Compute MSE. (Round your answer to two decimal places.)
MSE =
What is the forecast for week 7? (Round your answer to two decimal places.)
(d) Compare the three-week moving average approach with the exponential smoothing approach using a = 0.2. Which appears to provide more accurate forecasts based on MSE? Explain.
O The exponential smoothing using a = 0.2 provides a better forecast since it has a larger MSE than the three-week moving average approach.
O The three-week moving average provides a better forecast since it has a larger MSE than the smoothing approach.
O The three-week moving average provides a better forecast since it has a smaller MSE than the smoothing approach.
O The exponential smoothing using a = 0.2 provides a better forecast since it has a smaller MSE than the three-week moving average approach.
(e) Use a smoothing constant of a = 0.4 to compute the exponential smoothing forecasts.
Time Series
Week
Forecast
Value
1
18
2
11
3
13
4
10
5
17
12
Does a smoothing constant of 0.2 or 0.4 appear to provide more accurate forecasts based on MSE? Explain.
O The exponential smoothing using a = 0.2 provides a better forecast since it has a smaller MSE than the exponential smoothing using a = 0.4.
O The exponential smoothing using a = 0.4 provides a better forecast since it has a larger MSE than the exponential smoothing using a = 0.2.
O The exponential smoothing using a = 0.4 provides a better forecast since it has a smaller MSE than the exponential smoothing using a = 0.2.
O The exponential smoothing using a = 0.2 provides a better forecast since it has a larger MSE than the exponential smoothing using a = 0.4.
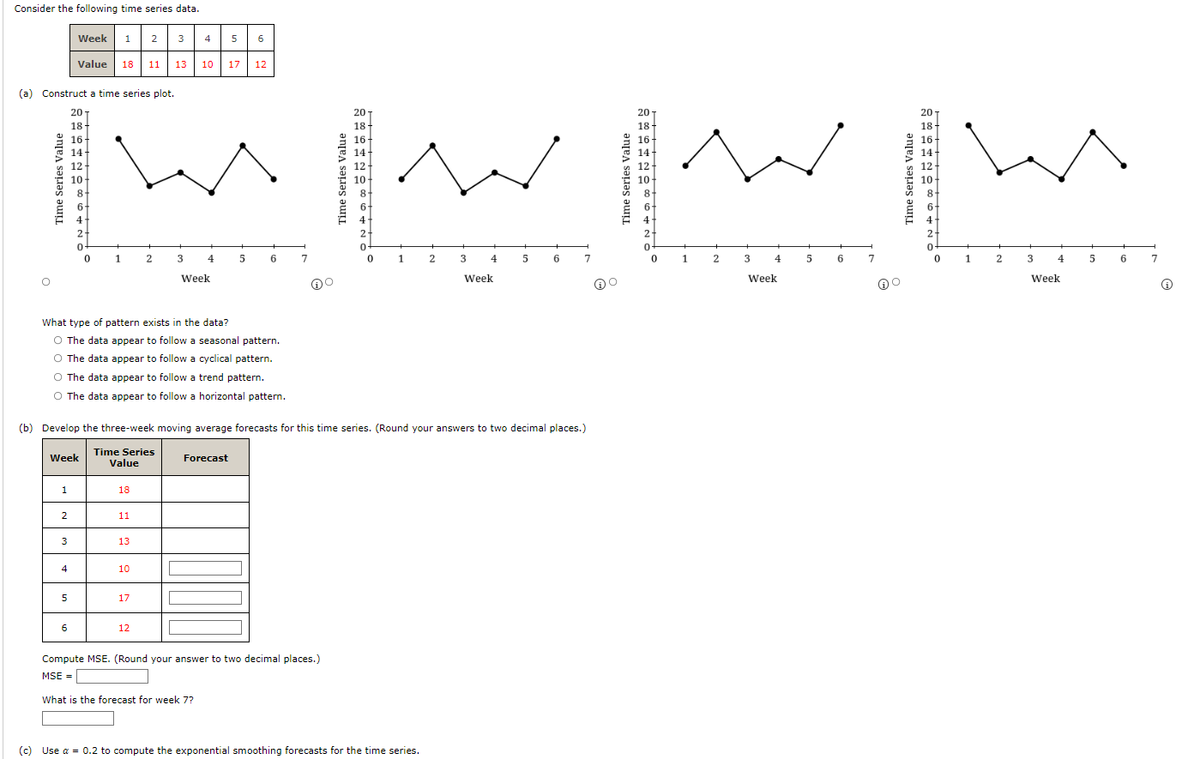
Transcribed Image Text:Consider the following time series data.
Week 1
| 2
3
4
5
6
Value 18 11
13
10
17
12
(a) Construct a time series plot.
20
20
201
18-
16+
14+
20
18+
16+
14
18
18
16
16
14
14
12
12
12
12
10
10
10
10
8+
6+
8+
8.
6.
6
6.
4
4
4
4
2-
2
2
2
1
2
3
4
5
7.
1
2
3
4
5
6
7
1
2
4
5
6
7
1
2
3
4
5
6.
7
Week
Week
Week
Week
What type of pattern exists in the data?
O The data appear to follow a seasonal pattern.
O The data appear to follow a cyclical pattern.
O The data appear to follow a trend pattern.
O The data appear to follow a horizontal pattern.
(b) Develop the three-week moving average forecasts for this time series. (Round your answers to two decimal places.)
Time Series
Week
Forecast
Value
1
18
2
11
3
13
4
10
17
6
12
Compute MSE. (Round your answer to two decimal places.)
MSE =
What is the forecast for week 7?
(c) Use a = 0.2 to compute the exponential smoothing forecasts for the time series.
ime Series Value
Expert Solution
This question has been solved!
Explore an expertly crafted, step-by-step solution for a thorough understanding of key concepts.

This is a popular solution!

Trending now
This is a popular solution!

Step by step
Solved in 4 steps with 2 images

Recommended textbooks for you
MATLAB: An Introduction with Applications
Statistics
ISBN:
9781119256830
Author:
Amos Gilat
Publisher:
John Wiley & Sons Inc

Probability and Statistics for Engineering and th…
Statistics
ISBN:
9781305251809
Author:
Jay L. Devore
Publisher:
Cengage Learning

Statistics for The Behavioral Sciences (MindTap C…
Statistics
ISBN:
9781305504912
Author:
Frederick J Gravetter, Larry B. Wallnau
Publisher:
Cengage Learning
MATLAB: An Introduction with Applications
Statistics
ISBN:
9781119256830
Author:
Amos Gilat
Publisher:
John Wiley & Sons Inc
Probability and Statistics for Engineering and th…
Statistics
ISBN:
9781305251809
Author:
Jay L. Devore
Publisher:
Cengage Learning
Statistics for The Behavioral Sciences (MindTap C…
Statistics
ISBN:
9781305504912
Author:
Frederick J Gravetter, Larry B. Wallnau
Publisher:
Cengage Learning

Elementary Statistics: Picturing the World (7th E…
Statistics
ISBN:
9780134683416
Author:
Ron Larson, Betsy Farber
Publisher:
PEARSON

The Basic Practice of Statistics
Statistics
ISBN:
9781319042578
Author:
David S. Moore, William I. Notz, Michael A. Fligner
Publisher:
W. H. Freeman

Introduction to the Practice of Statistics
Statistics
ISBN:
9781319013387
Author:
David S. Moore, George P. McCabe, Bruce A. Craig
Publisher:
W. H. Freeman