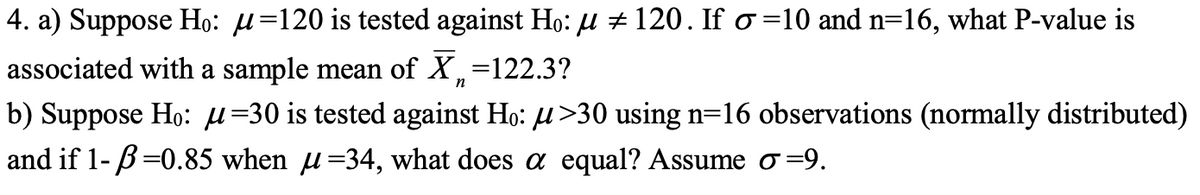
4. a) Suppose Ho: u=120 is tested against Ho: μ ‡ 120. If o=10 and n=16, what P-value is associated with a sample mean of X=122.3? b) Suppose H₁: µ=30 is tested against Họ: µ>30 using n=16 observations (normally distributed and if 1- ß=0.85 when u=34, what does a equal? Assume o=9.


Q: Read the scenario and decide which (if any) of the assumptions or conditions for using the Central…
A: The conditions for central limit theorem are: 1. The samples are drawn randomly and independently 2.…
Q: Suppose you have a bag containing 10 red balls, 8 blue balls, and 6 green balls. If you draw 2 balls…
A: It is given that the no. of balls of the colors red, blue, and green are 10, 8, and 6 respectively.…
Q: Read the scenario and decide which (if any) of the assumptions or conditions for using the Central…
A: The Central Limit Theorem (i.e., CLT) assumed that for a sufficiently large sample size (i.e.,…
Q: The measure of center that is not influenced by outliers, very large or small data is the: O median…
A: There are the following measures of central tendency. Mean Median Mode Midrange The formula for…
Q: Use these ordered pairs to help your scatter plot below ( Questions are ordered 1-14) 69,60 41,23…
A: Given Information: Actual Ages Guesses 69 60 41 23 47 38 59 30 43 37 42 47 42 30…
Q: Last August there were 702,924 scheduled passenger flights in a certain country, and in August of…
A: Given: In a certain country, Scheduled passengers flights in August 1998 = 722,811 Scheduled…
Q: 3. A pet shop recently started a promo where in if you buy at least a 25-gallon aquarium plus a…
A: From the provided information, the distribution of fish in the prize pool is given as: Fish No.…
Q: Categorize these measures of zoom teaching according to level: nominal, ordinal, interval or ratio.…
A: Given that Categorize these measures of zoom teaching according to level: nominal, ordinal, interval…
Q: Assume that we believe that the arithmetic return has a mean of 0 and that, from histori- $100 into…
A: The Chebyshev inequality states that for any random variable X with finite mean μ and variance σ2,…
Q: A national health organization says that 30% of teenagers have tried smoking cigarettes. A health…
A: given data N =3500n = 280x = 56claim : p = 0.30
Q: A local fast food restaurant interviews every 10th customer placing an order at the counter. What…
A: According to the question, a local fast food restraunt interviews every 10th customer placing an…
Q: A math class analyzed the lengths of the songs played on a local radio station. The lengths of the…
A: Suppose the random variable x defines the lengths of the songs played on a local radio station.
Q: Some important analyses of survey results require that you know the actual number of subjects whose…
A: Given that: Total number of executives in a survey, n=130 Success probability, p=48%
Q: Bluereef real estate agent wants to form a relationship between the prices of houses, how many…
A: Given information: The MINITAB output is given.
Q: Grear Tire Company has produced a new tire with an estimated mean lifetime mileage of 35,500 miles.…
A: Given that: Population mean, μ=35500 Population standard deviation, σ=4500
Q: A recent study investigated the impact of owning a pet on a patient's recovery from depression.…
A: Given that, a recent study investigated the impact of owning a pet on a patient's recovery from…
Q: 5. The mgf of a discrete random variable X is given by 1 1 M(t)=ce'|- (2-e²)² (3-e²)²] (a) Find the…
A: Given information: Mt=cet12-et2+13-et2, t<ln 2
Q: What is the correlation between a person's income and their level of education, and to what extent…
A:
Q: According to the historical data, 73.2% of the 20-year-olds live until 65 years old. A random sample…
A: Given Information: 73.2% of the 20-year-olds live until 65 years old i.e., p=0.732 Sample size n=46…
Q: Find the indicated IQ score. The graph to the right depicts IQ scores of adults, and those scores…
A: GivenMean(μ)=100standard deviation(σ)=15
Q: In a small town, there are 3,000 registered voters. An editor of a local newspaper would like to…
A:
Q: it didnt say round though. So is it 62 or 62.4?
A: Since we can't have a fraction of a person, we need to round this value to the nearest whole number.
Q: The University of the East Europe is interested in the overall performance of its students in the…
A: Here the given information is The University of the East Europe is interested in the overall…
Q: Let X be a joint Gaussian random vector X E[X] = [] ; Ex= = X 1 2 with mean and covariance tiven by:…
A: As per our company guidelines we are supposed to answer only first question. Kindly repost other…
Q: Casey Deesel is a sports agent negotiating a contract for Titus Johnston, an athlete in the National…
A: Given Casey has trained a full regression tree on 304 observations.
Q: Assume that adults have IQ scores that are normally distributed with a mean of μ= 105 and a standard…
A: The given values are: μ=105 and σ=15.
Q: A weighted dice satisfies the following probability distribution: p(1) = p(5), 4.p(3) = p(2), and…
A: To solve this problem, we first need to determine the probability of rolling each number on the…
Q: QUESTION 20 The time spent on social media platforms per day by adults has a distribution with a…
A: The given mean is 125 and standard deviation is 16.
Q: f a population has a variance of 7, what is the variance of the sampling distribution of its mean?…
A: Solution: Given information: n= 5 Sample size σ2= 7 Population variance
Q: A random sample of 500 ZU students are surveyed to determine if they own a tablet. It was found that…
A: Suppose p is the true population proportion of the ZU students who own tablets.
Q: QUESTION 4 Let X, Y be joint Gaussian random variables with E[X]=0,E[Y]=0, Var[X]=2, Var[Y] =4 and…
A: Hi! Thank you for the question. As per the honor code, we are allowed to answer 1 question at a…
Q: Suppose you are given a multiple-choice test with 10 questions, each with 4 answer choices. If you…
A: The question is about discrete prob. distribution Given : No. of multiple choice questions ( n ) =…
Q: In Ventura County, the height measurements of ten-year-old children are approximately normally…
A: Note:- “Since you have posted multiple questions, we will provide the solution only to the first…
Q: How do you evaluate the coefficients for the independent variables against the size and statistical…
A: To test the hypothesis that location is the most important factor in determining the price of a…
Q: Application of z-test/t-test 1. The college students in a university go through an average of 500…
A: The question is about hypo. testing Given : Popl. mean no. of disposable cups in a year ( μ ) = 500…
Q: In a survey, 15 people were asked how much they spent on their child's last birthday gift. The…
A: Given,sample size(n)=15sample mean(x¯)=$35.6standard deviation(s)=$4.9degrees of…
Q: A manufacturer knows that their items have a normally distributed lifespan, with a mean of 9.9…
A: Answer:- Given, A manufacturer knows that their items have a normally distributed lifespan. Here,…
Q: scenario and decide which (if any) of the assumptions or conditions for using the Central Limit…
A: Assuming that the appliances are homogenous and the inspector selects the washers randomly, there…
Q: In a study, the data you collect is miles per gallon of cars. Is this data quantitative or…
A: Here the given statement is In a study, the data you collect is miles per gallon of cars. Is this…
Q: According to the manufacturer's data, 6.5% of the items coming off the production line have a…
A: “Since you have asked multiple questions, we will solve the first question for you. If you want any…
Q: For a 95% confidence interval, what value will you use for t*? Group of answer choices 1.960 2.030…
A: There are two types of houses, houses with a view of a nearby lake and houses with no view of the…
Q: A bakery offers two types of pastries: croissants (C) and muffins (M). The probability that a custom…
A: C denotes the event that a customer buys croissant and M denotes the event that a customer buys…
Q: The amount of time to complete a physical activity in a PE class is normally distributed with a mean…
A: Given that mean of 35 seconds and a standard deviation of 5.4 seconds. a) What is the probability…
Q: Refer to the table which summarizes the results of testing for a certain disease. A test subject is…
A: From given : Positive test Negative test Total Has disease 144 17 161 Does not have disease…
Q: Q1. N-2500, Xbar= 64, $^2- 800 a). Calculate Standard Error b). Calculate 95% Confidence Interval…
A: n = 2500x¯ = 64s2 = 800
Q: Fill in the blank in the following statement. If a truck weighs 25% more than a car, then the…
A: We are given four options for the given question- 125,25,75,-75
Q: 2. A new drug is tested at two concentrations, C1 and C2, to boost white blood cell counts in…
A: This question examines the efficacy of a new drug in boosting white blood cell counts in leukaemia…
Q: What’s the probability of picking at most 3 heads in 10 tosses of a coin?
A:
Q: Ho: [Select] H₁: [Select] test statistic; [Select] P value: [Select] [Select] conclusion: The data…
A: We have given information, with usual notation written as follows: The population proportion p=0.35…
Q: A school has 3 math classes, each with 25 students, and 2 science classes, each with 30 students. If…
A:


Trending now
This is a popular solution!

Step by step
Solved in 3 steps with 3 images

- 2. Consider a study where students are measured on whether they had an internship during their time at WKU (Y/N) and whether they had a job at graduation (Y/N). If we wanted to test whether having an internship was associated with having a job at graduation (i.e., internship holders were more likely to have jobs), why would the chi-square test be inappropriate for this hypothesis? How should we analyze our data?The number of contaminating particles on a silicon waferprior to a certain rinsing process was determined for eachwafer in a sample of size 100, resulting in the followingfrequencies:Number of particles 0 1 2 3 4 5 6 7Frequency 1 2 3 12 11 15 18 10Number of particles 8 9 10 11 12 13 14Frequency 12 4 5 3 1 2 1a. What proportion of the sampled wafers had at leastone particle? At least five particles?b. What proportion of the sampled wafers had betweenfive and ten particles, inclusive? Strictly between fiveand ten particles?c. Draw a histogram using relative frequency on thevertical axis. How would you describe the shape of thehistogram?1. The sample mean weights for two varieties of lettuce grown for 16 days in a controlled environment are 3.259 and 1.413 and the corresponding sample standard deviations are .400 and .220. If the sample sizes for the two varieties are 9 and 6 respectively, what would be the pair of hypotheses to test if the two varieties of lettuce have the same average weight? (Given: weight of each variety of lettuce is normally distributed). A. H0: μ1 ≠ μ2 vs H1: μ1 = μ2 B. H0: μ1 = μ2 vs H1: μ1 ≠ μ2 C. H0: μ1 > μ2 vs H1: μ1 ≤ μ2 D. H0: μ1 ≤ μ2 vs H1: μ1 > μ2 2. At 5% level, what are the critical values for testing equality of mean weights in problem 1? A. 2.18 B. -2.18 and 2.18 C. -1.78 D.-1.78 and 1.78 3.What is the best decision using critical value approach in problem 1? A. The computed test statistic falls in the critical region and we do not reject the null hypothesis. B. The computed test statistic does not fall in the critical…
- 1. The sample mean weights for two varieties of lettuce grown for 16 days in a controlled environment are 3.259 and 1.413 and the corresponding sample standard deviations are .400 and .220. If the sample sizes for the two varieties are 9 and 6 respectively, what would be the pair of hypotheses to test if the two varieties of lettuce have the same average weight? (Given: weight of each variety of lettuce is normally distributed). A. H0: μ1 ≠ μ2 vs H1: μ1 = μ2 B. H0: μ1 = μ2 vs H1: μ1 ≠ μ2 C. H0: μ1 > μ2 vs H1: μ1 ≤ μ2 D. H0: μ1 ≤ μ2 vs H1: μ1 > μ2 2.What would be the degree of freedom for the test statistic in problem 1? A. 6 B. 9 C. 12.7 D. 14 3. What would be the computed test statistic in problem 1? A. 2.93 B. 3.57 C. 8.44 D. 11.481. The sample mean weights for two varieties of lettuce grown for 16 days in a controlled environment are 3.259 and 1.413 and the corresponding sample standard deviations are .400 and .220. If the sample sizes for the two varieties are 9 and 6 respectively, what would be the pair of hypotheses to test if the two varieties of lettuce have the same average weight? (Given: weight of each variety of lettuce is normally distributed). A. H0: μ1 ≠ μ2 vs H1: μ1 = μ2 B. H0: μ1 = μ2 vs H1: μ1 ≠ μ2 C. H0: μ1 > μ2 vs H1: μ1 ≤ μ2 D. H0: μ1 ≤ μ2 vs H1: μ1 > μ2 2. What is the best decision using critical value approach in problem 1? A. The computed test statistic falls in the critical region and we do not reject the null hypothesis. B. The computed test statistic does not fall in the critical region and we do not reject the null hypothesis. C. The computed test statistic falls in the critical region and we reject the null hypothesis. D.The computed…1. The sample mean weights for two varieties of lettuce grown for 16 days in a controlled environment are 3.259 and 1.413 and the corresponding sample standard deviations are .400 and .220. If the sample sizes for the two varieties are 9 and 6 respectively, what would be the pair of hypotheses to test if the two varieties of lettuce have the same average weight? (Given: weight of each variety of lettuce is normally distributed). A. H0: μ1 ≠ μ2 vs H1: μ1 = μ2 B. H0: μ1 = μ2 vs H1: μ1 ≠ μ2 C.H0: μ1 > μ2 vs H1: μ1 ≤ μ2 D. H0: μ1 ≤ μ2 vs H1: μ1 > μ2 2. What is the best decision using critical value approach in problem 1? A. The computed test statistic falls in the critical region and we do not reject the null hypothesis. B. The computed test statistic does not fall in the critical region and we do not reject the null hypothesis. C. The computed test statistic falls in the critical region and we reject the null hypothesis. D. The computed test statistic does not fall…
- Suppose that a random sample of size 1 is to be taken from a finite population of size N. a. How many possible samples are there?b. Identify the relationship between the possible sample means and the possible observations of the variable under consideration.c. What is the difference between taking a random sample of size 1 from a population and selecting a member at random from the population?A report in LTO stated that the average age of taxis in the Philippines is 9 years. An operations manager of a large taxi company selects a sample of 40 taxis and finds the average age of the taxis is 8.2 years. The σ of the population is 2.3 years. At ? = 0.05, can it be concluded that the average age of the taxis in his company is less than the national average?5.39 ● The following data on degree of exposure to 242Cmalpha particles (x) and the percentage of exposed cellswithout aberrations (y) appeared in the paper “Chromosome Aberrations Induced in Human Lymphocytes by D-TNeutrons” (Radiation Research [1984]: 561–573):
- 23. The State of California claims the population average of the amount of ice cream each Californian eats in the month of September is 6.85 pints with population standard deviation of 1.35 pints. An SRS of 500 Californians resulted in a sample average of 6.75 pints eaten per person in the month of September At alpha = 0.05 , is there evidence to support the State of California's claim that Californians eat an average of 6.85 pints of ice cream in the month of September? Find the p-value ?25. The State of California claims the population average of the amount of ice cream each Californian eats in the month of September is 6.85 pints with population standard deviation of 1.35 pints. An SRS of 500 Californians resulted in a sample average of 6.75 pints eaten per person in the month of September . At alpha=0.05, is there evidence to support the State of California's claim that Californians eat an average of 6.85 pints of ice cream in the month of September? Write a conclusion using the context of the problem.Listed below are the lead concentrations in muμg/g measured in different traditional medicines. Use a 0.010.01 significance level to test the claim that the mean lead concentration for all such medicines is less than 1717 muμg/g. Assume that the lead concentrations in traditional medicines are normally distributed. 1010 13.513.5 16.516.5 19.519.5 2121 13.513.5 3.53.5 22.522.5 1313 3.53.5 What are the null and alternative hypotheses? A. Upper H 0H0: muμequals=1717 muμg/g Upper H 1H1: muμless than<1717 muμg/g B. Upper H 0H0: muμequals=1717 muμg/g Upper H 1H1: muμgreater than>1717 muμg/g C. Upper H 0H0: muμequals=1717 muμg/g Upper H 1H1: muμnot equals≠1717 muμg/g D. Upper H 0H0: muμgreater than>1717 muμg/g Upper H 1H1: muμless than<1717 muμg/g Determine the test statistic. (Round to two decimal places as needed.) Determine the P-value. (Round to…


